Mapping · work examples
Mapping, WebGIS and 3D models
What a client receives when asking the Studio for a map: a 3D atlas to explore, a WebGIS to consult in the browser, map sheets ready for the report. The examples on this page are built on the Amalfi Coast with real official data; the project content is simulated.
Demonstration only. These are not real projects and concern no client, public body or owner. Terrain, orthophotos, Natura 2000 sites, cadastre and trails come from official and open sources; hydrogeological constraint, crop suitability, tree inventory and interventions are simulated and marked as such. The applications are in Italian.
Two tools that open in the browser
The Studio’s maps do not end in a PDF. The same work is also delivered as an interactive tool: the client, the technical office or the designer open it in the browser, with nothing to install, and find every layer with its source.
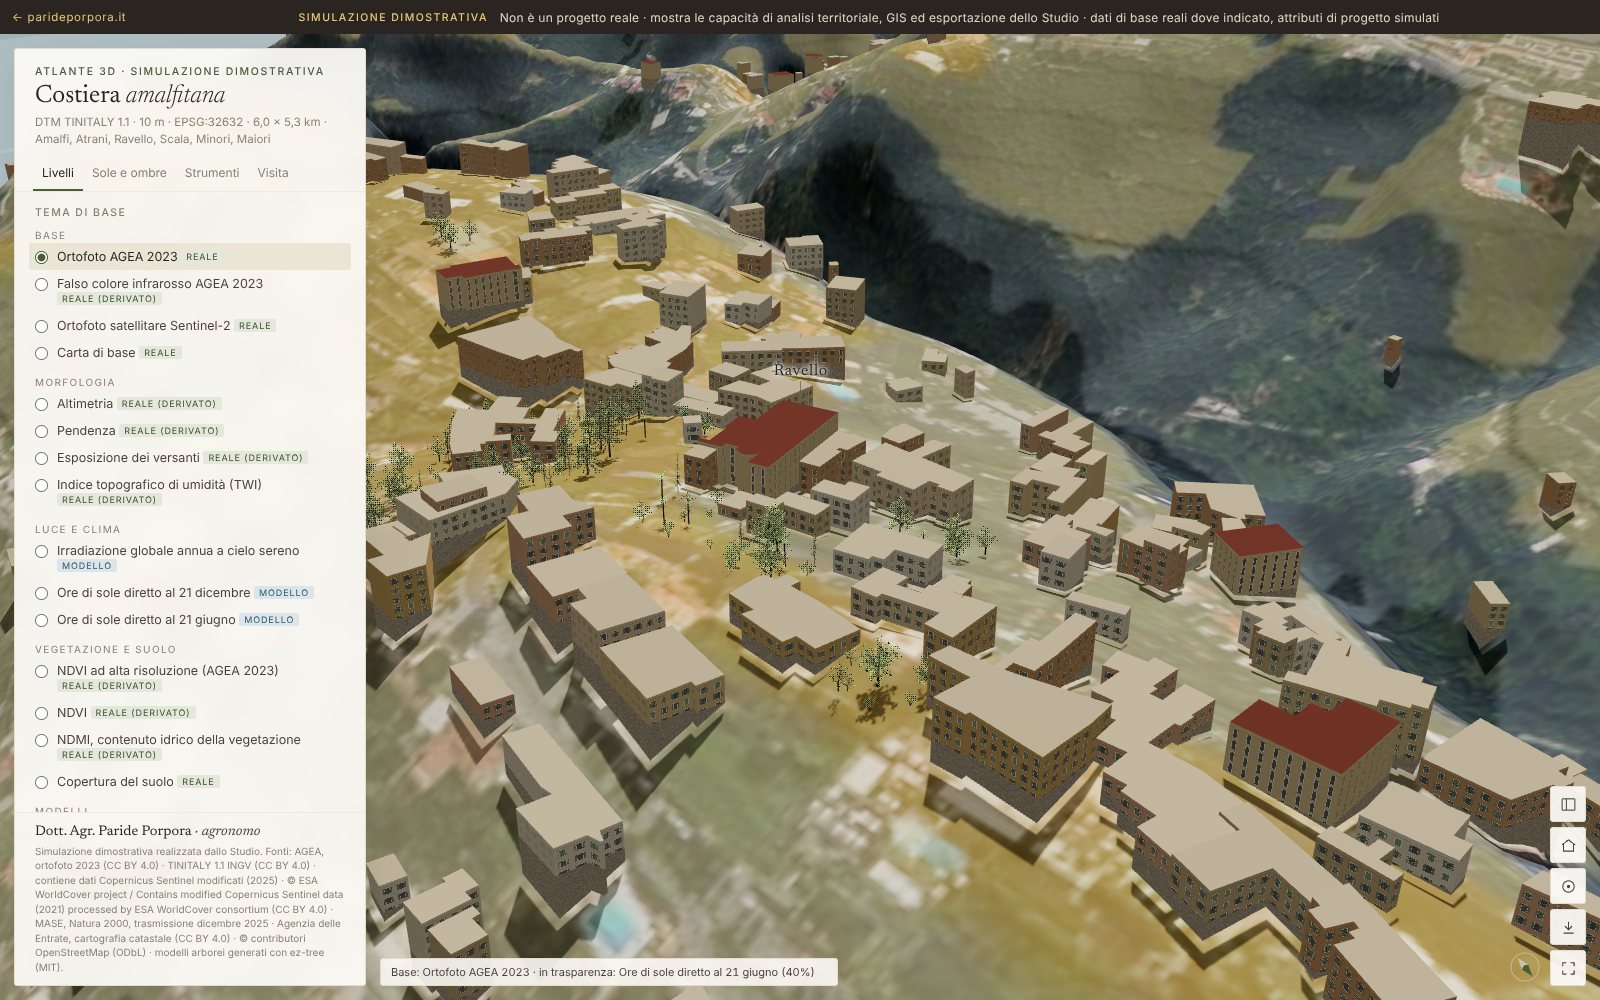
3D land atlas
A 10 m digital terrain model with the 20 cm AGEA orthophoto, 3D buildings and trees, shadows computed from the real sun for any day and hour. Seventeen themes and twelve boundaries can be overlaid with transparency: slope, aspect, irradiation, sunshine hours, vegetation vigour (NDVI), Natura 2000, landscape constraints, cadastre. A 21-step guided tour shows the uses for planning, agriculture, forestry, tourism and green-space design.
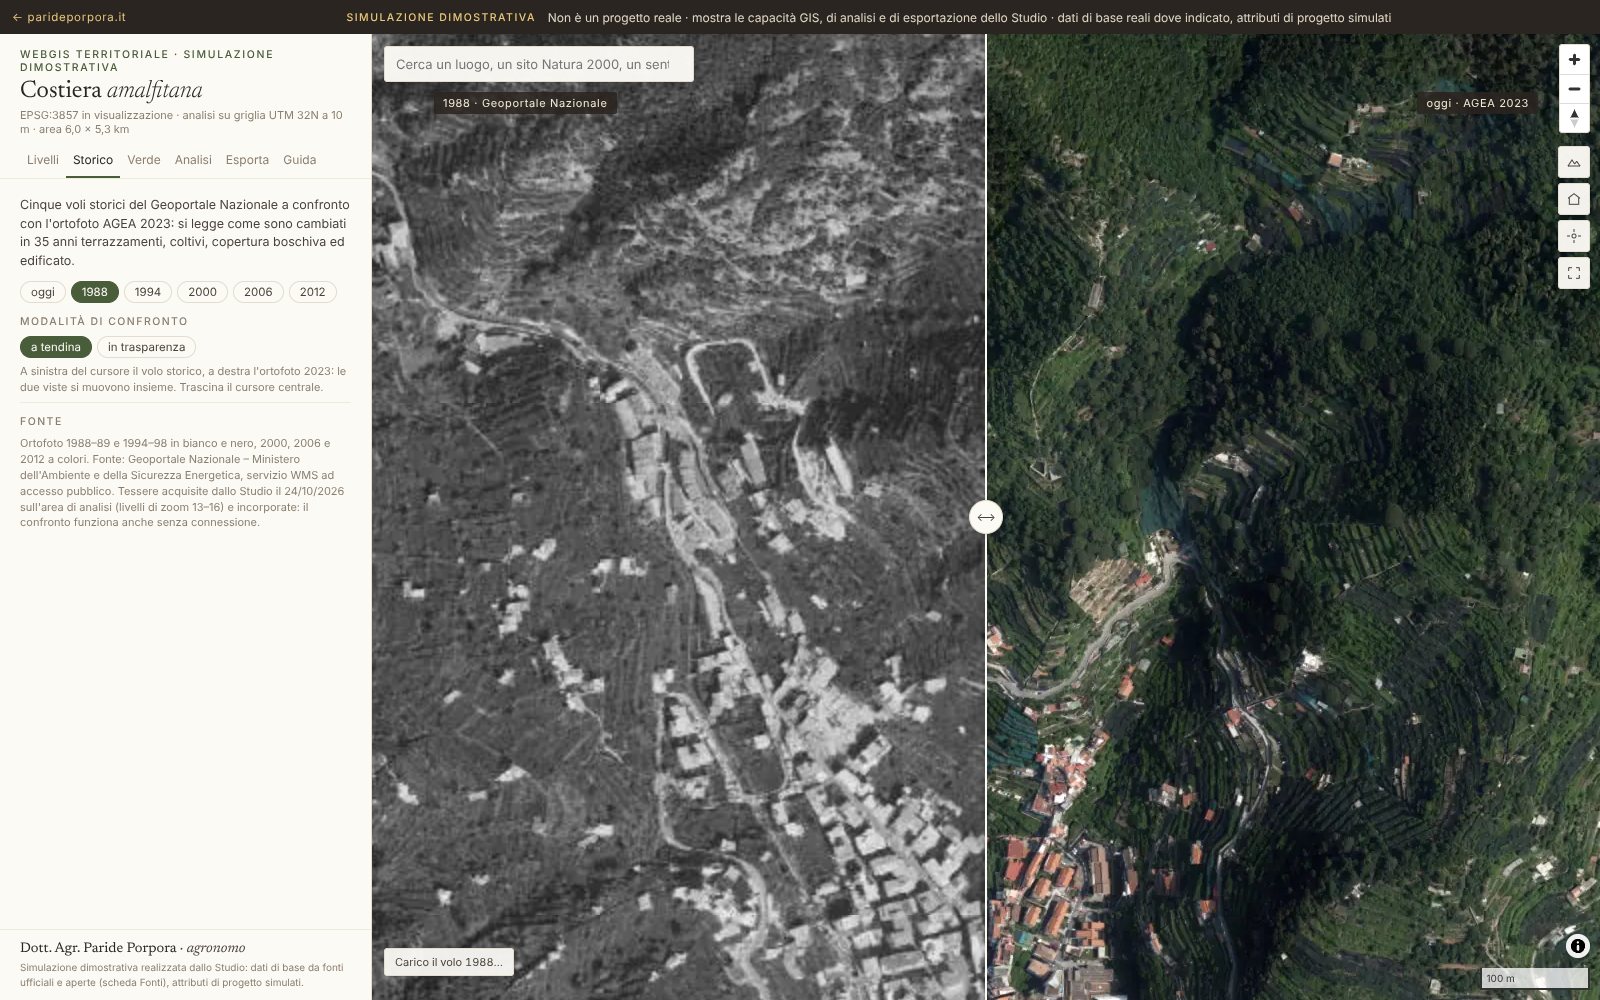
Territorial WebGIS
A complete geographic information system in the browser: today’s orthophoto compared with historic surveys back to 1988, analytical themes, Natura 2000 and constraints, 28,339 cadastral parcels, a tree inventory with tree records and an intervention plan. Every point can be queried, profiles traced, an area drawn to get a report; layers export to GeoJSON, KML and CSV.
The two applications load about 25 MB of data: they work best on a computer or tablet with a good connection.
Map sheets
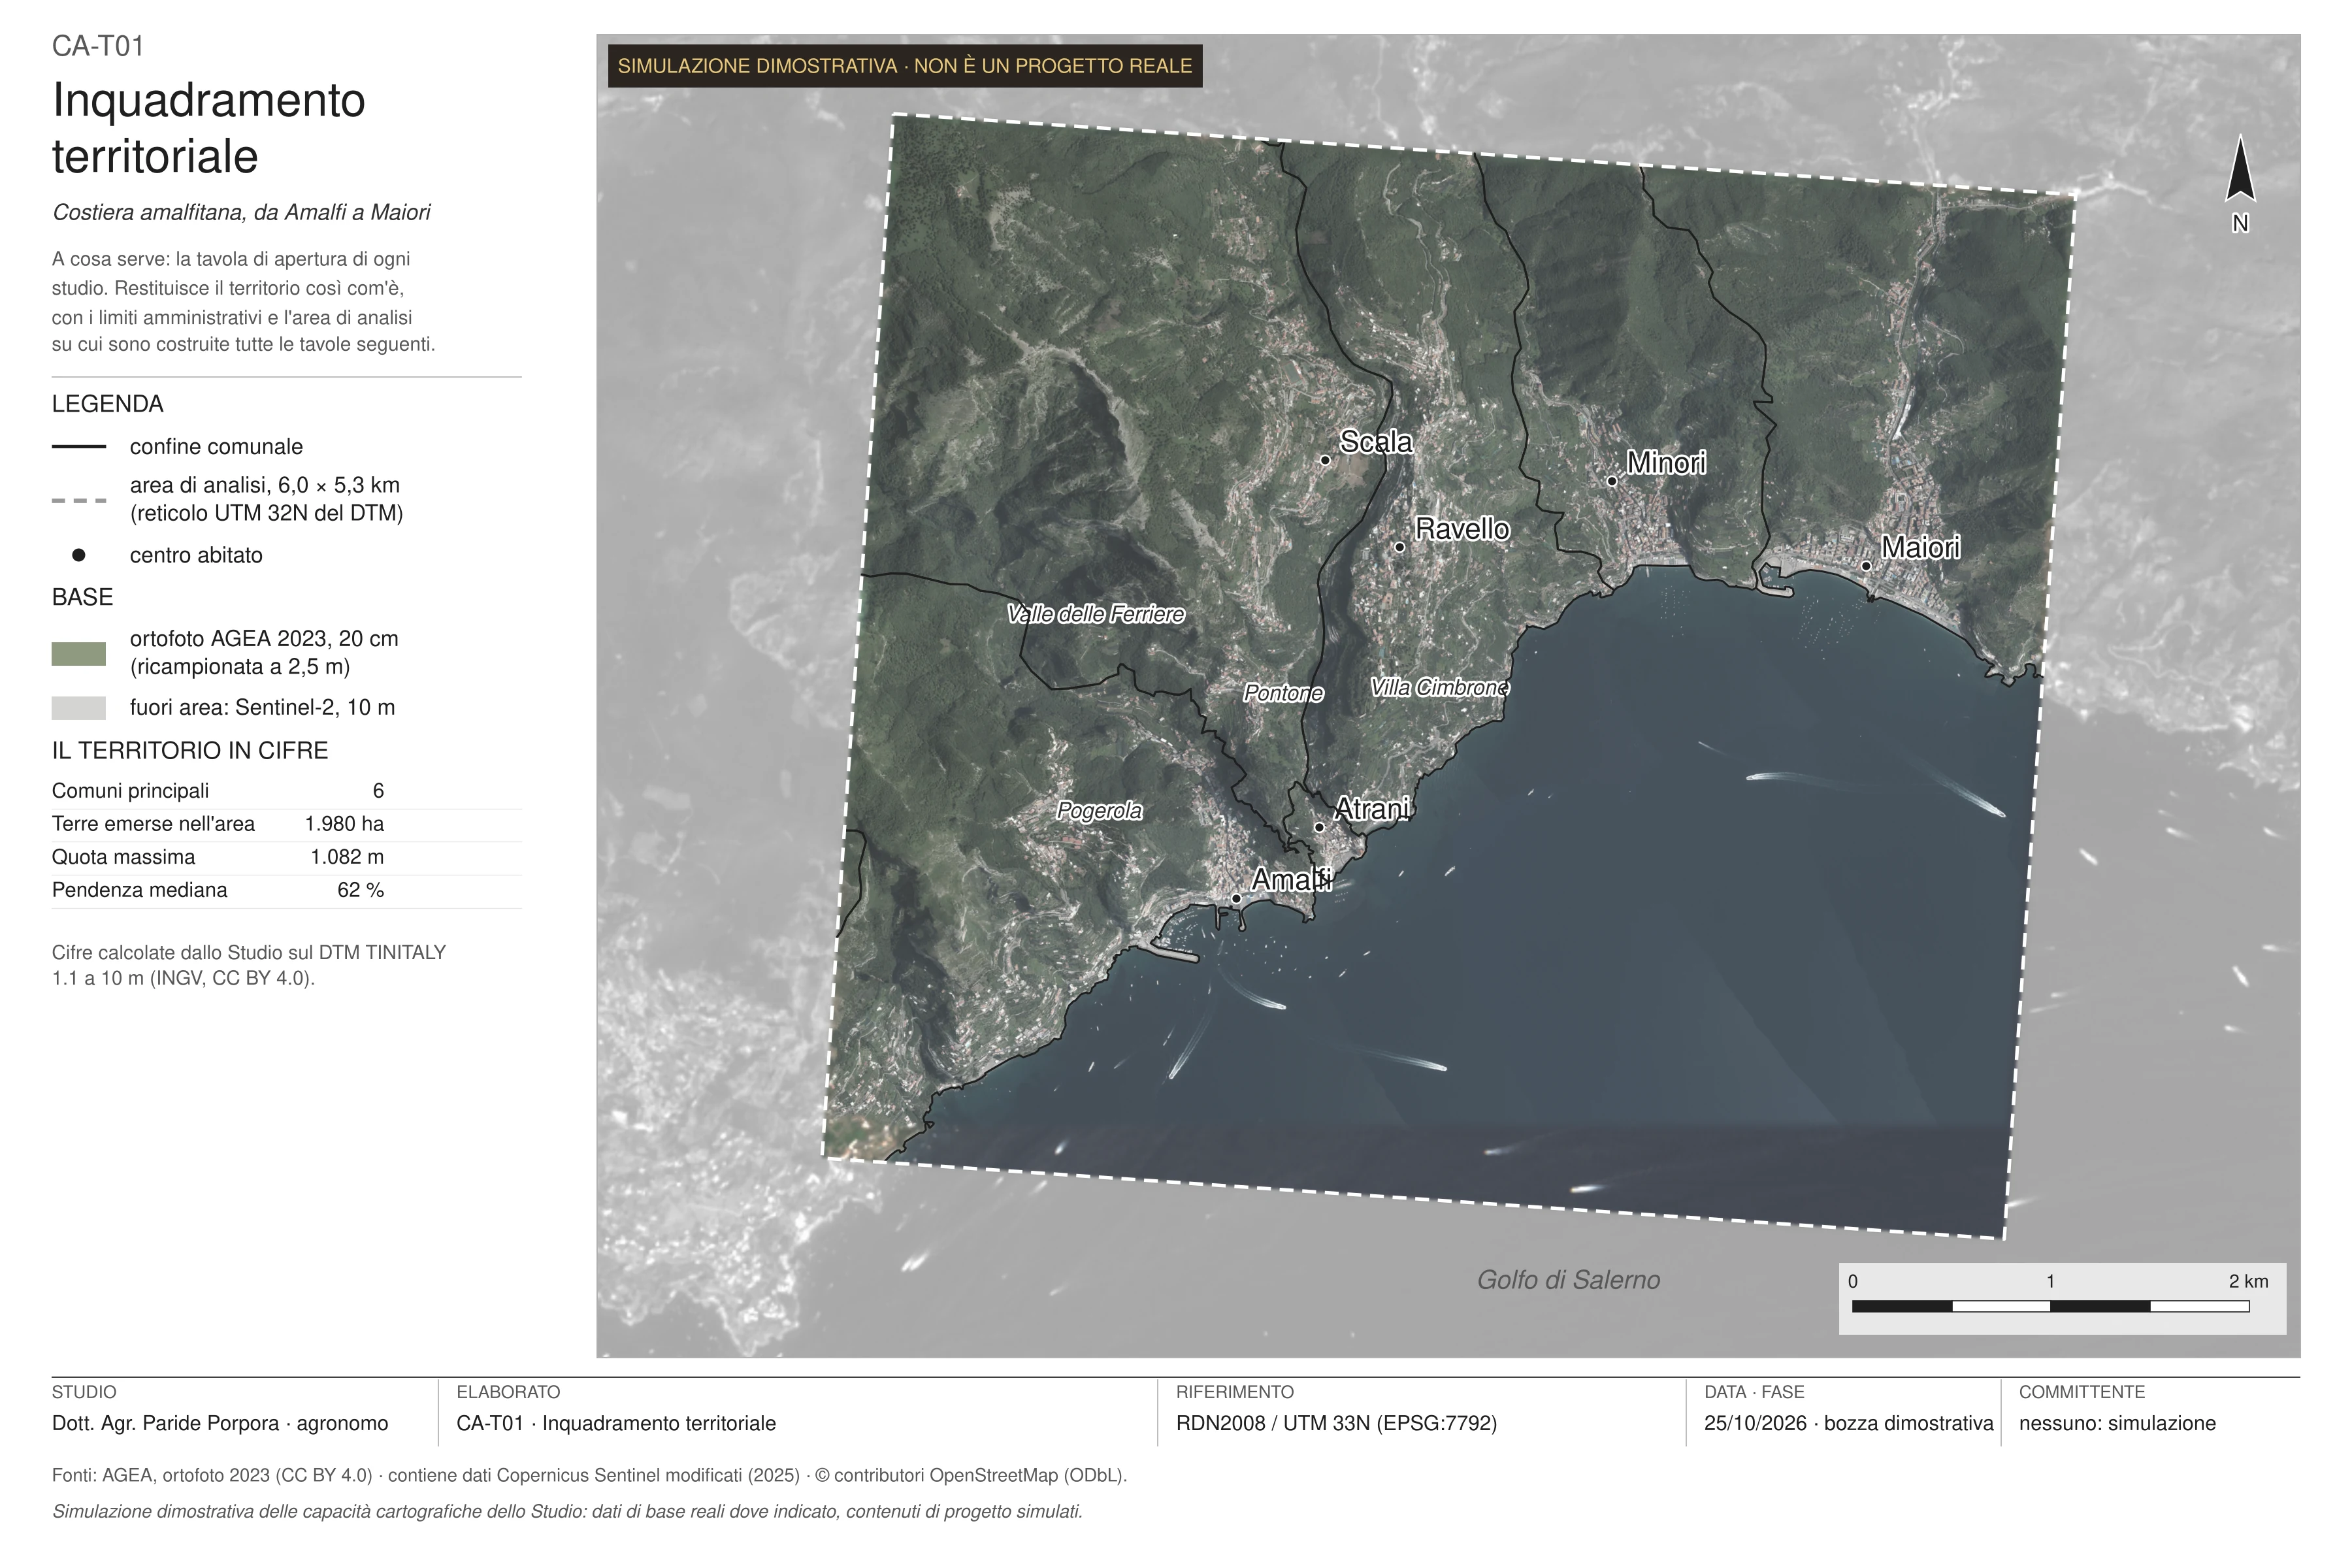
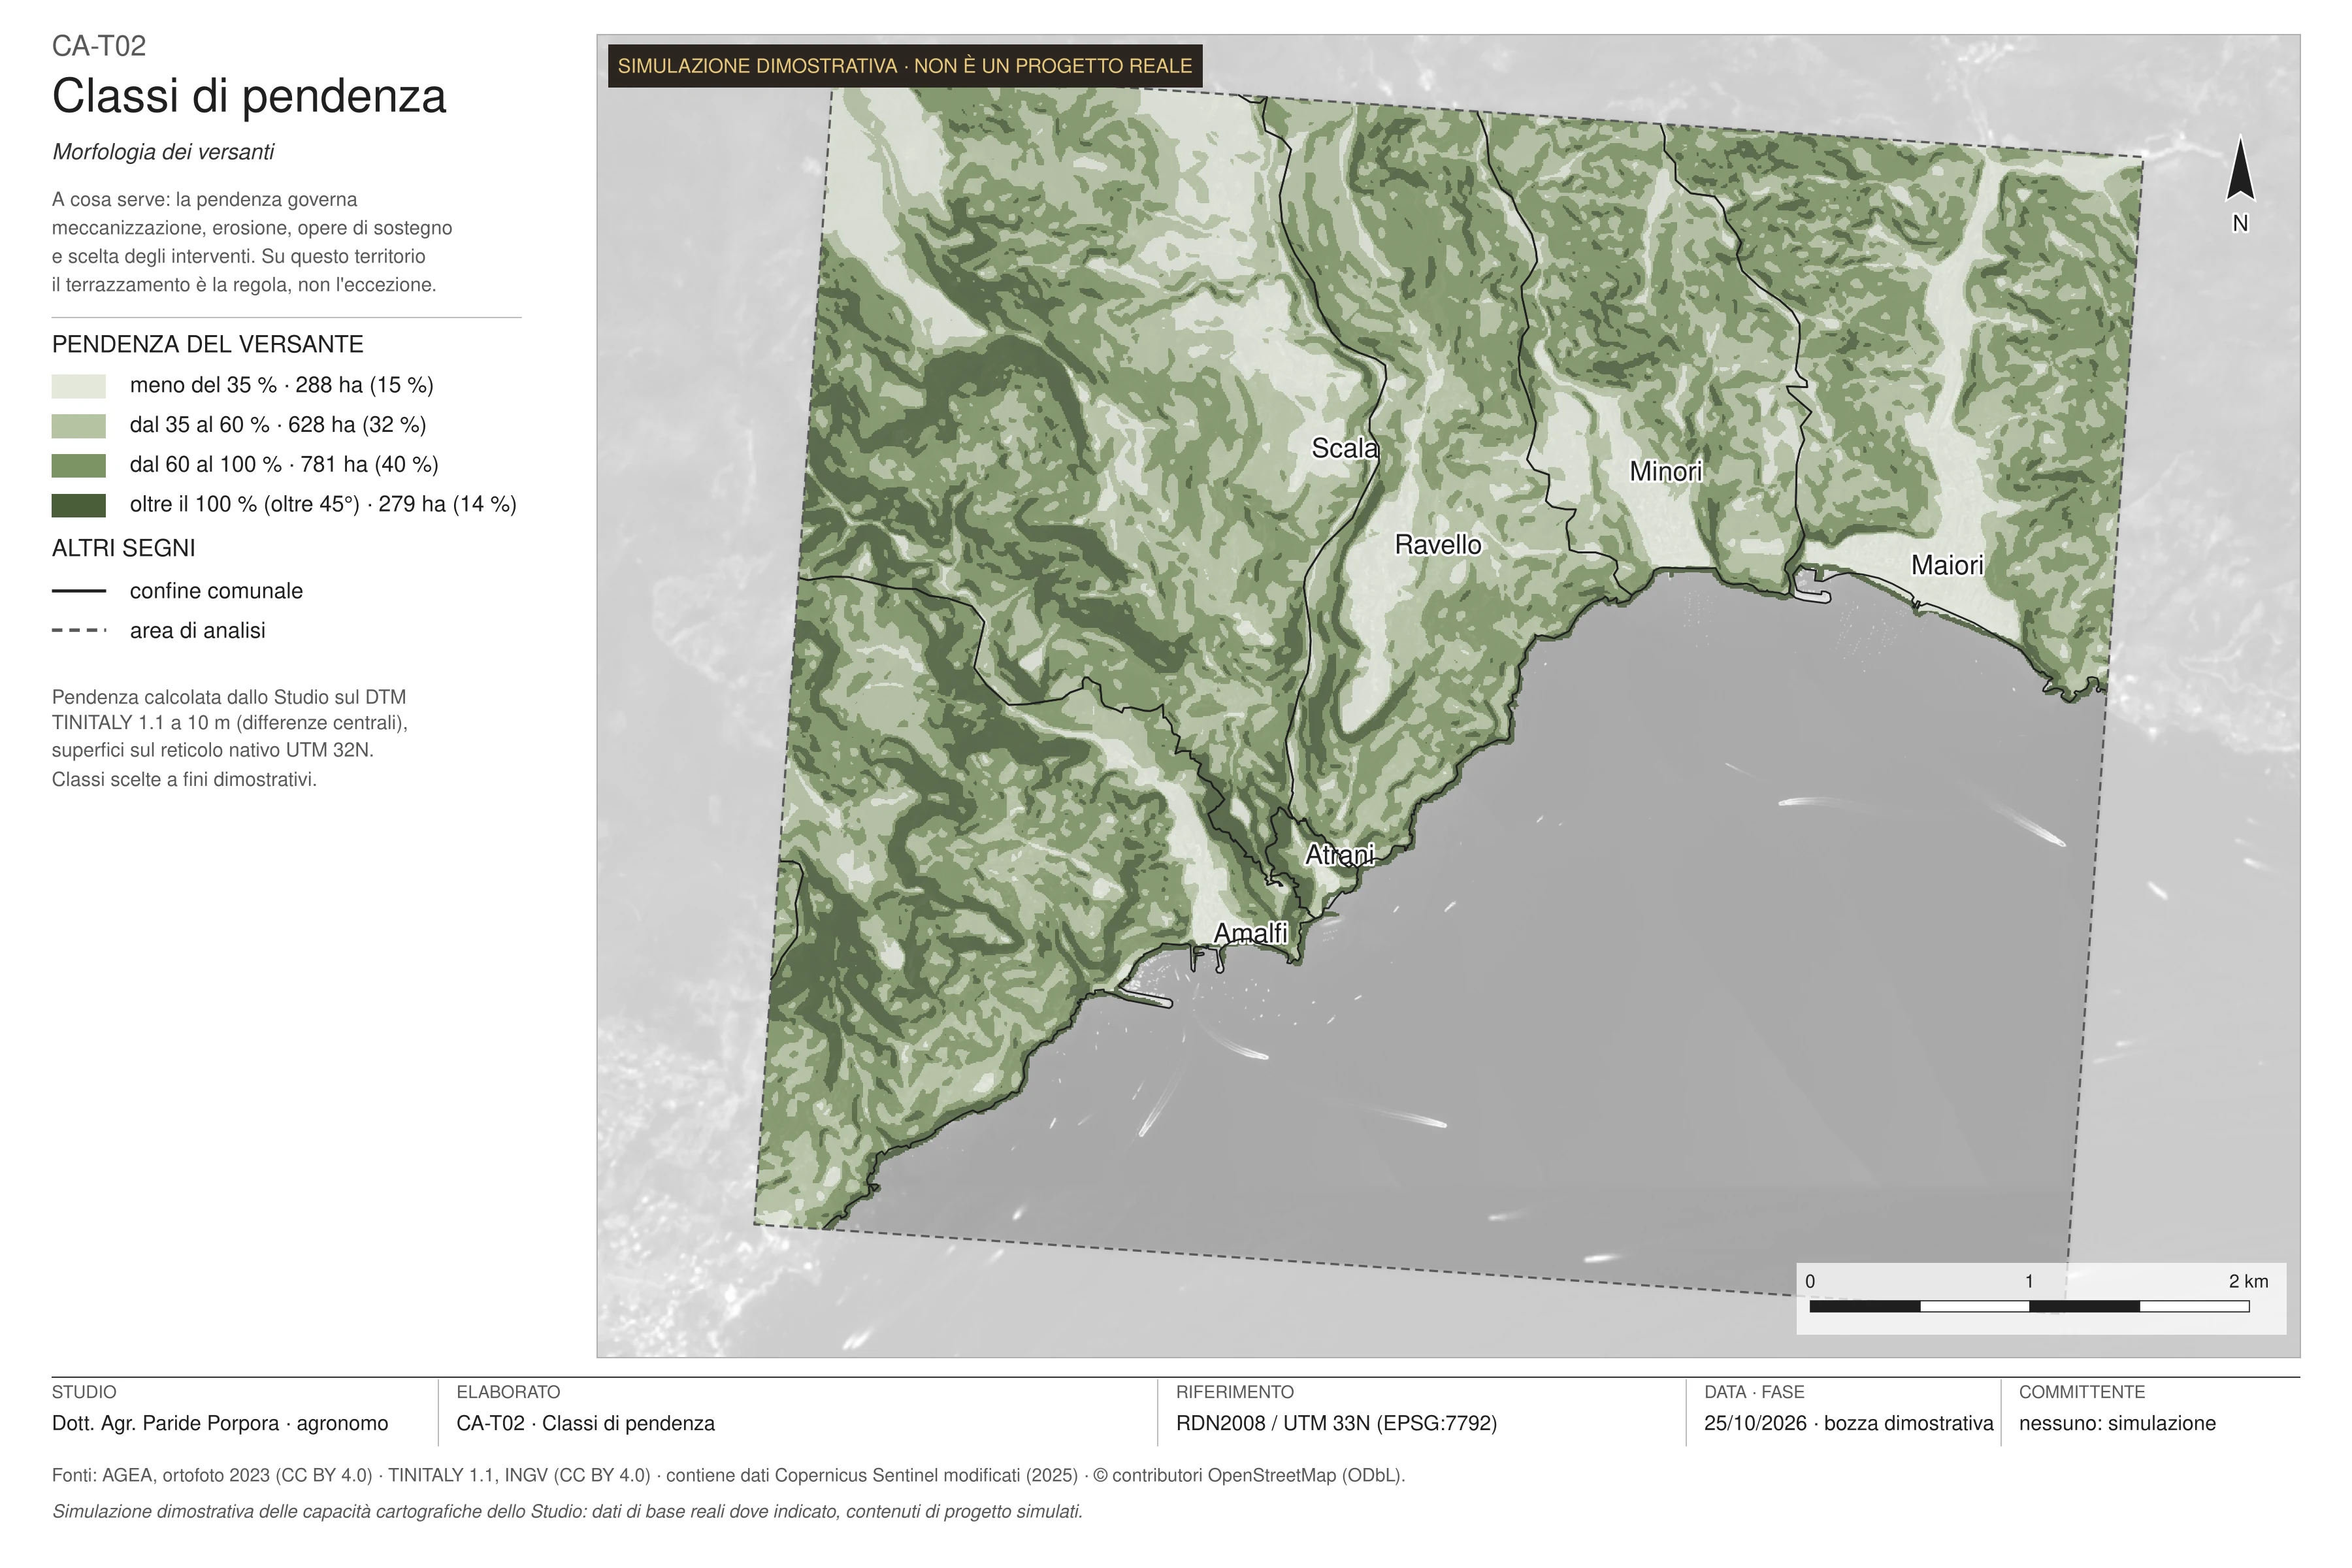
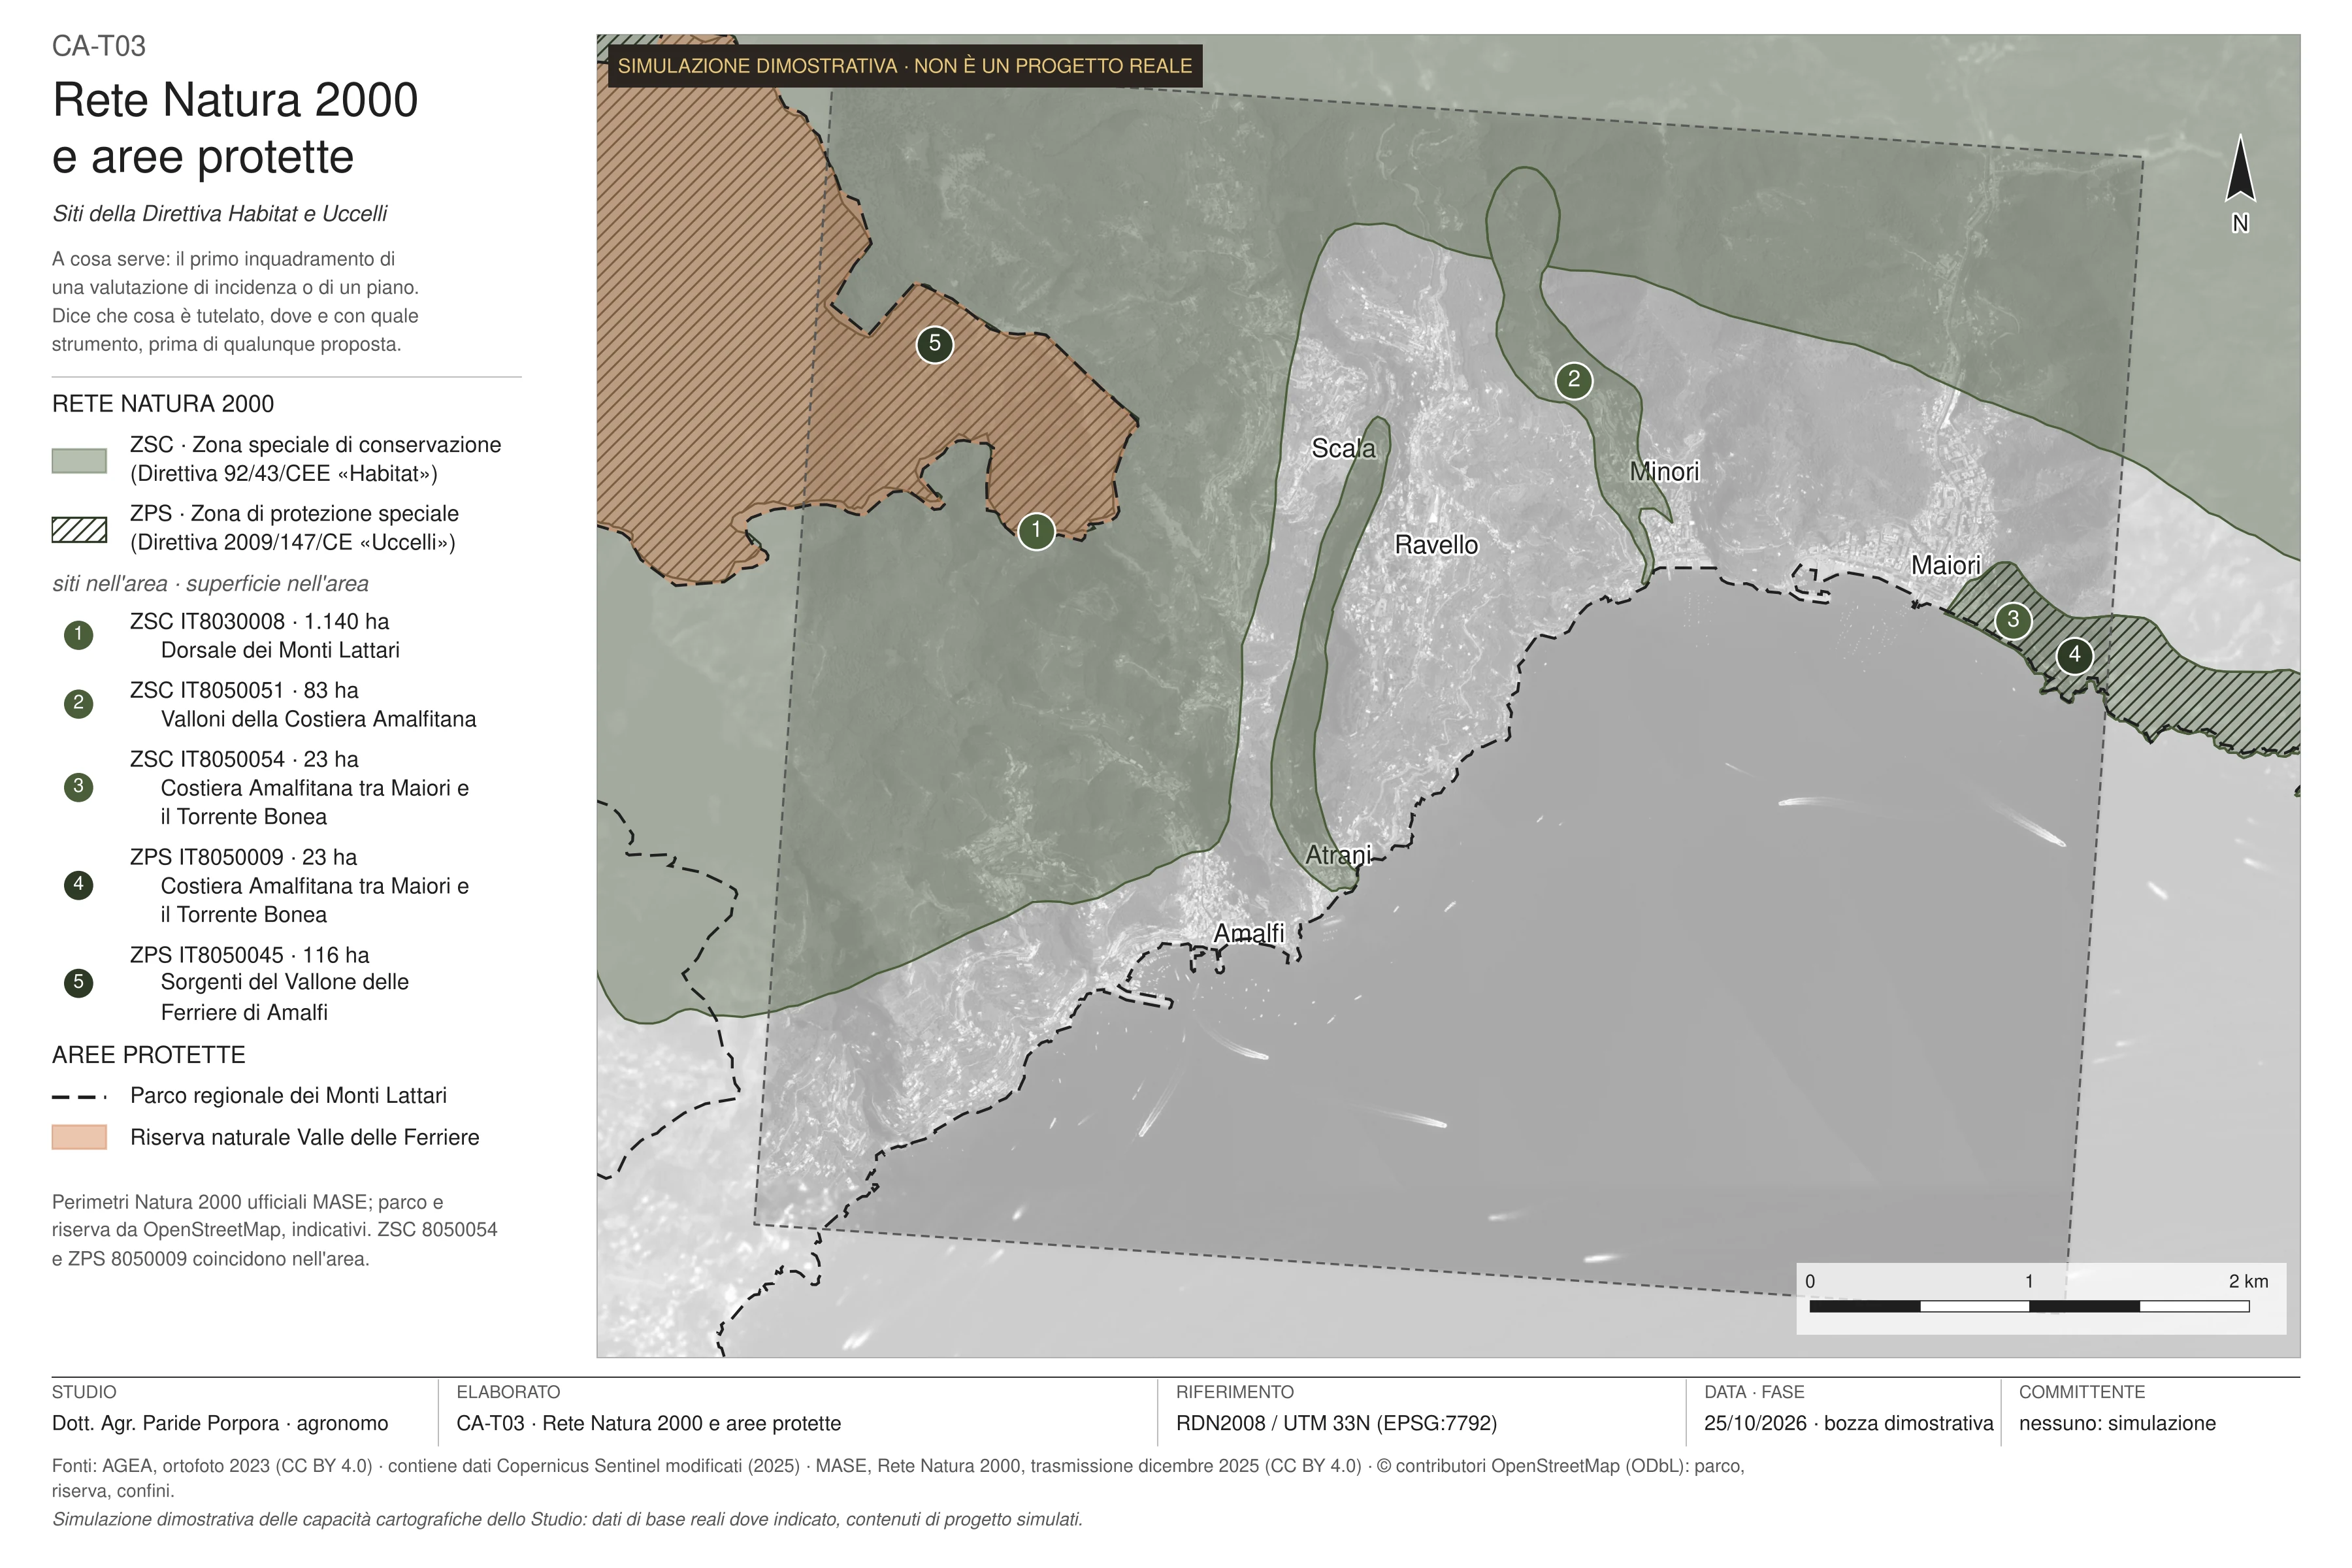
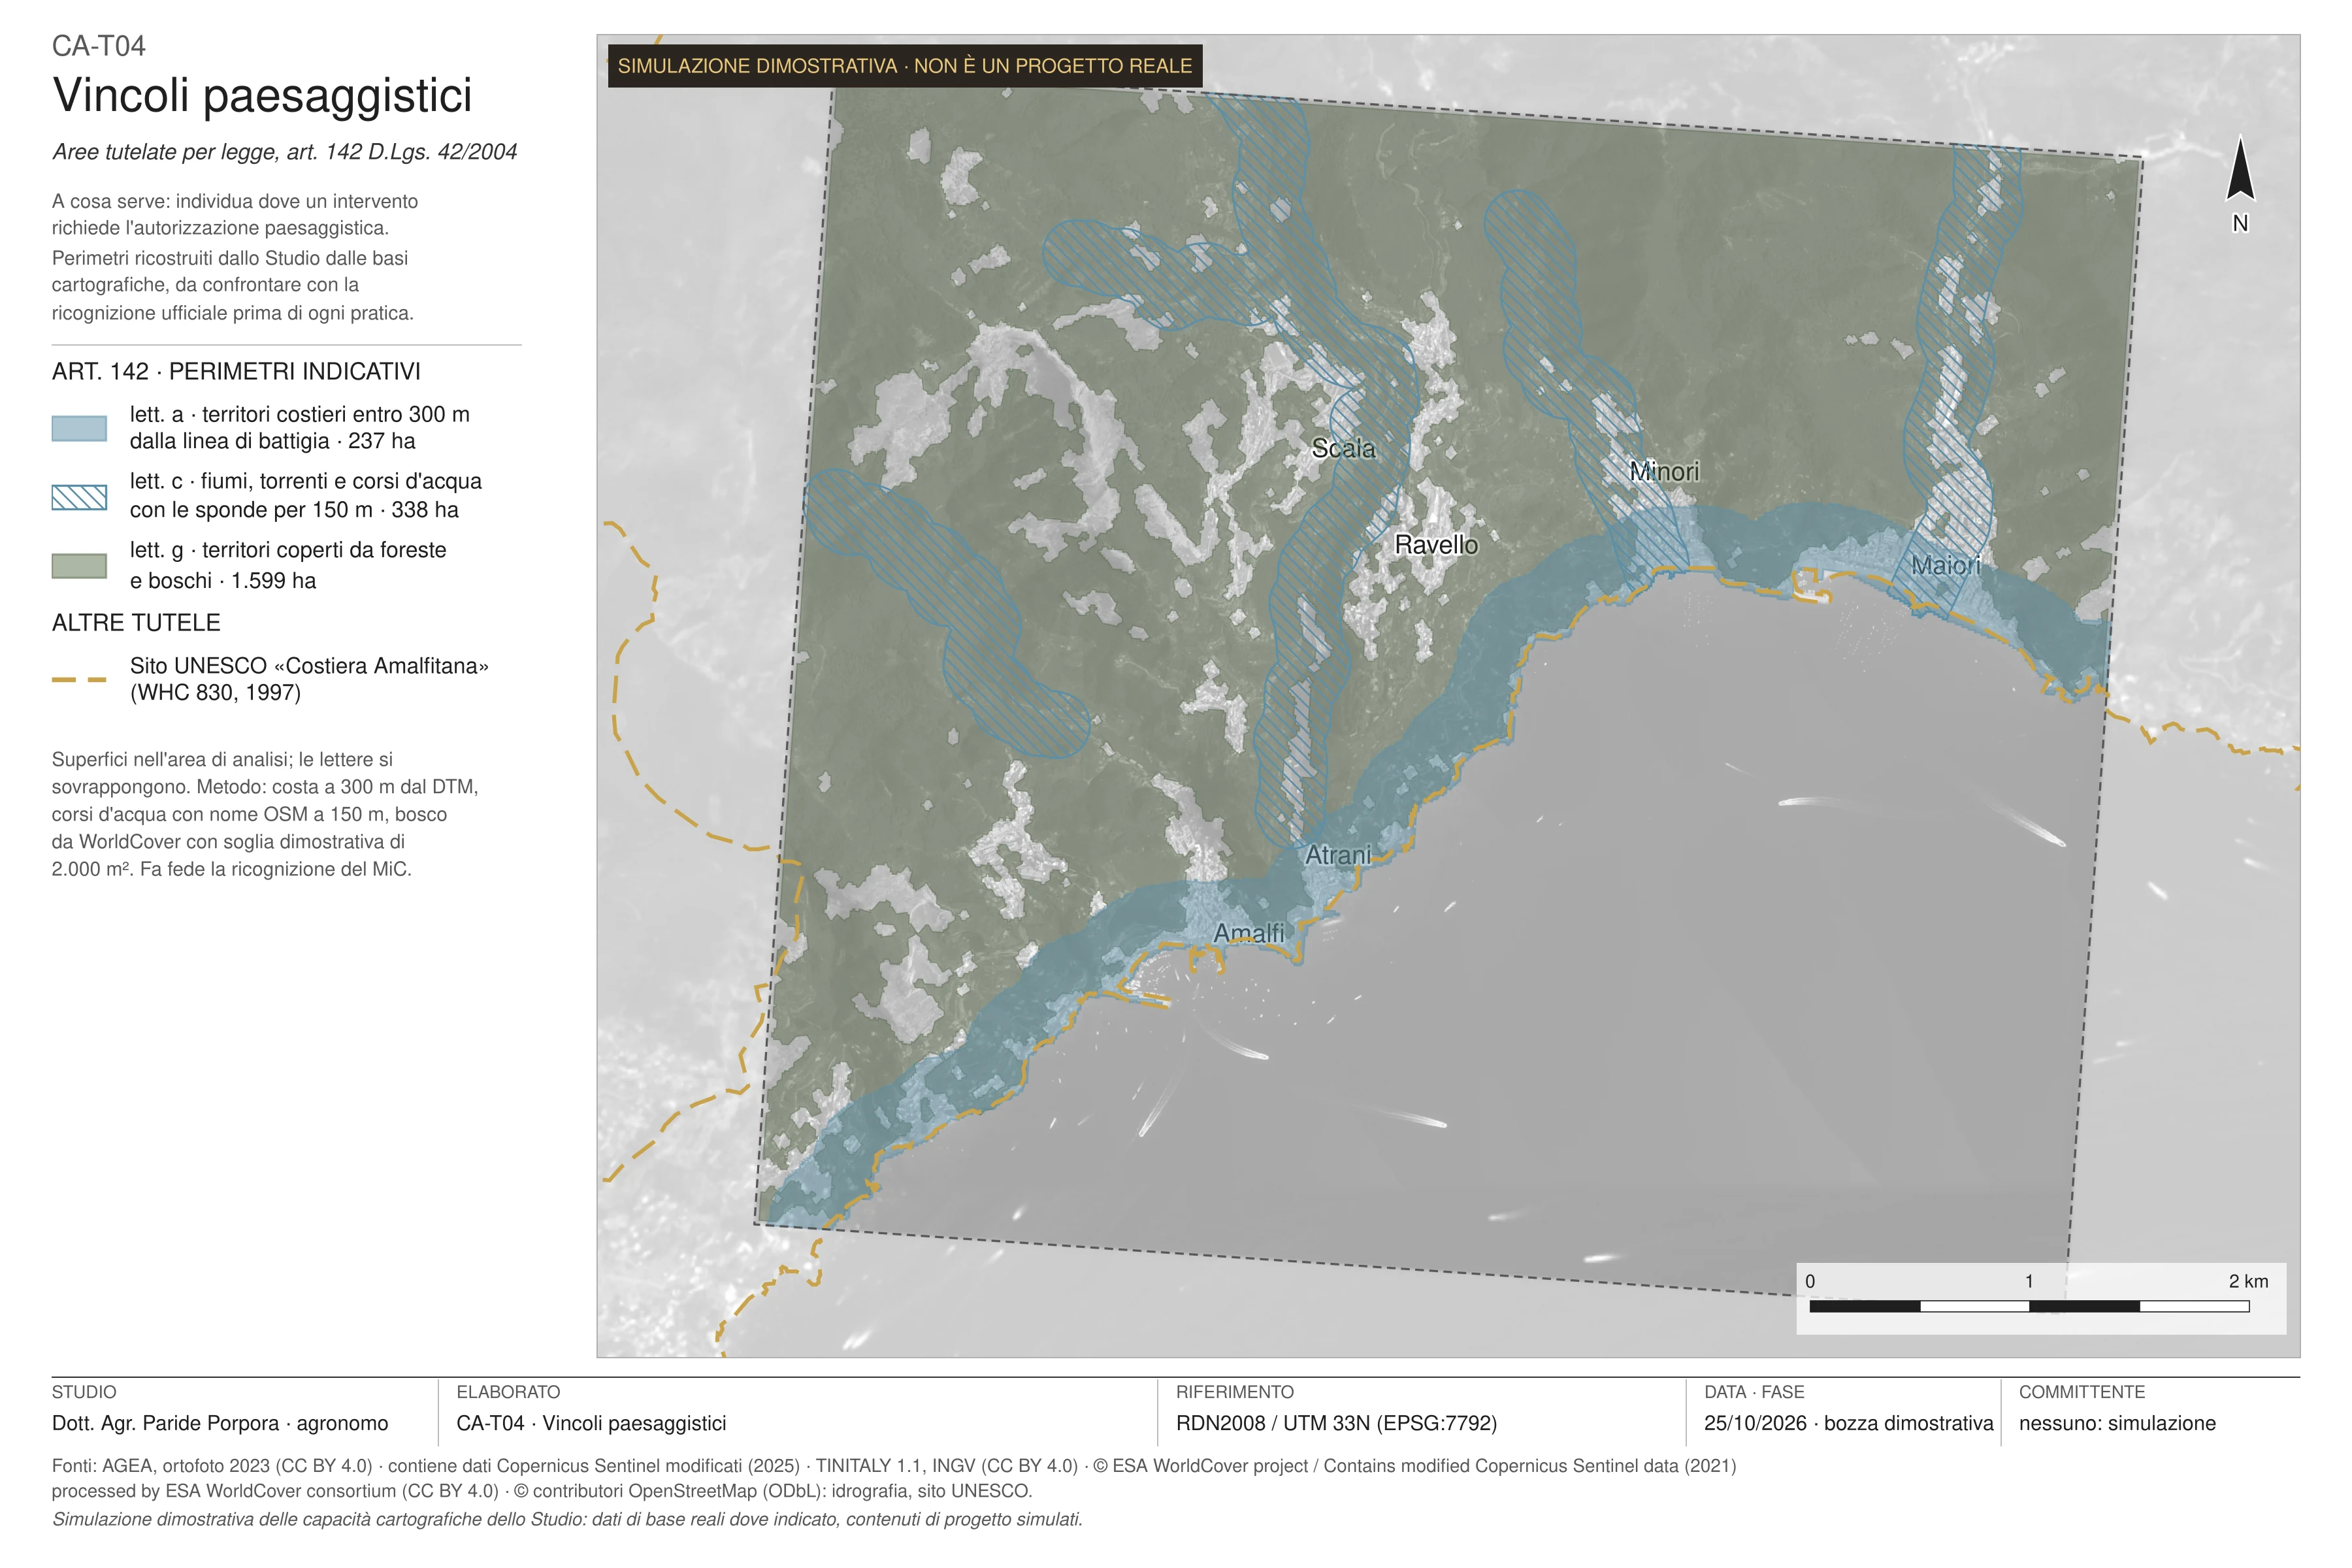
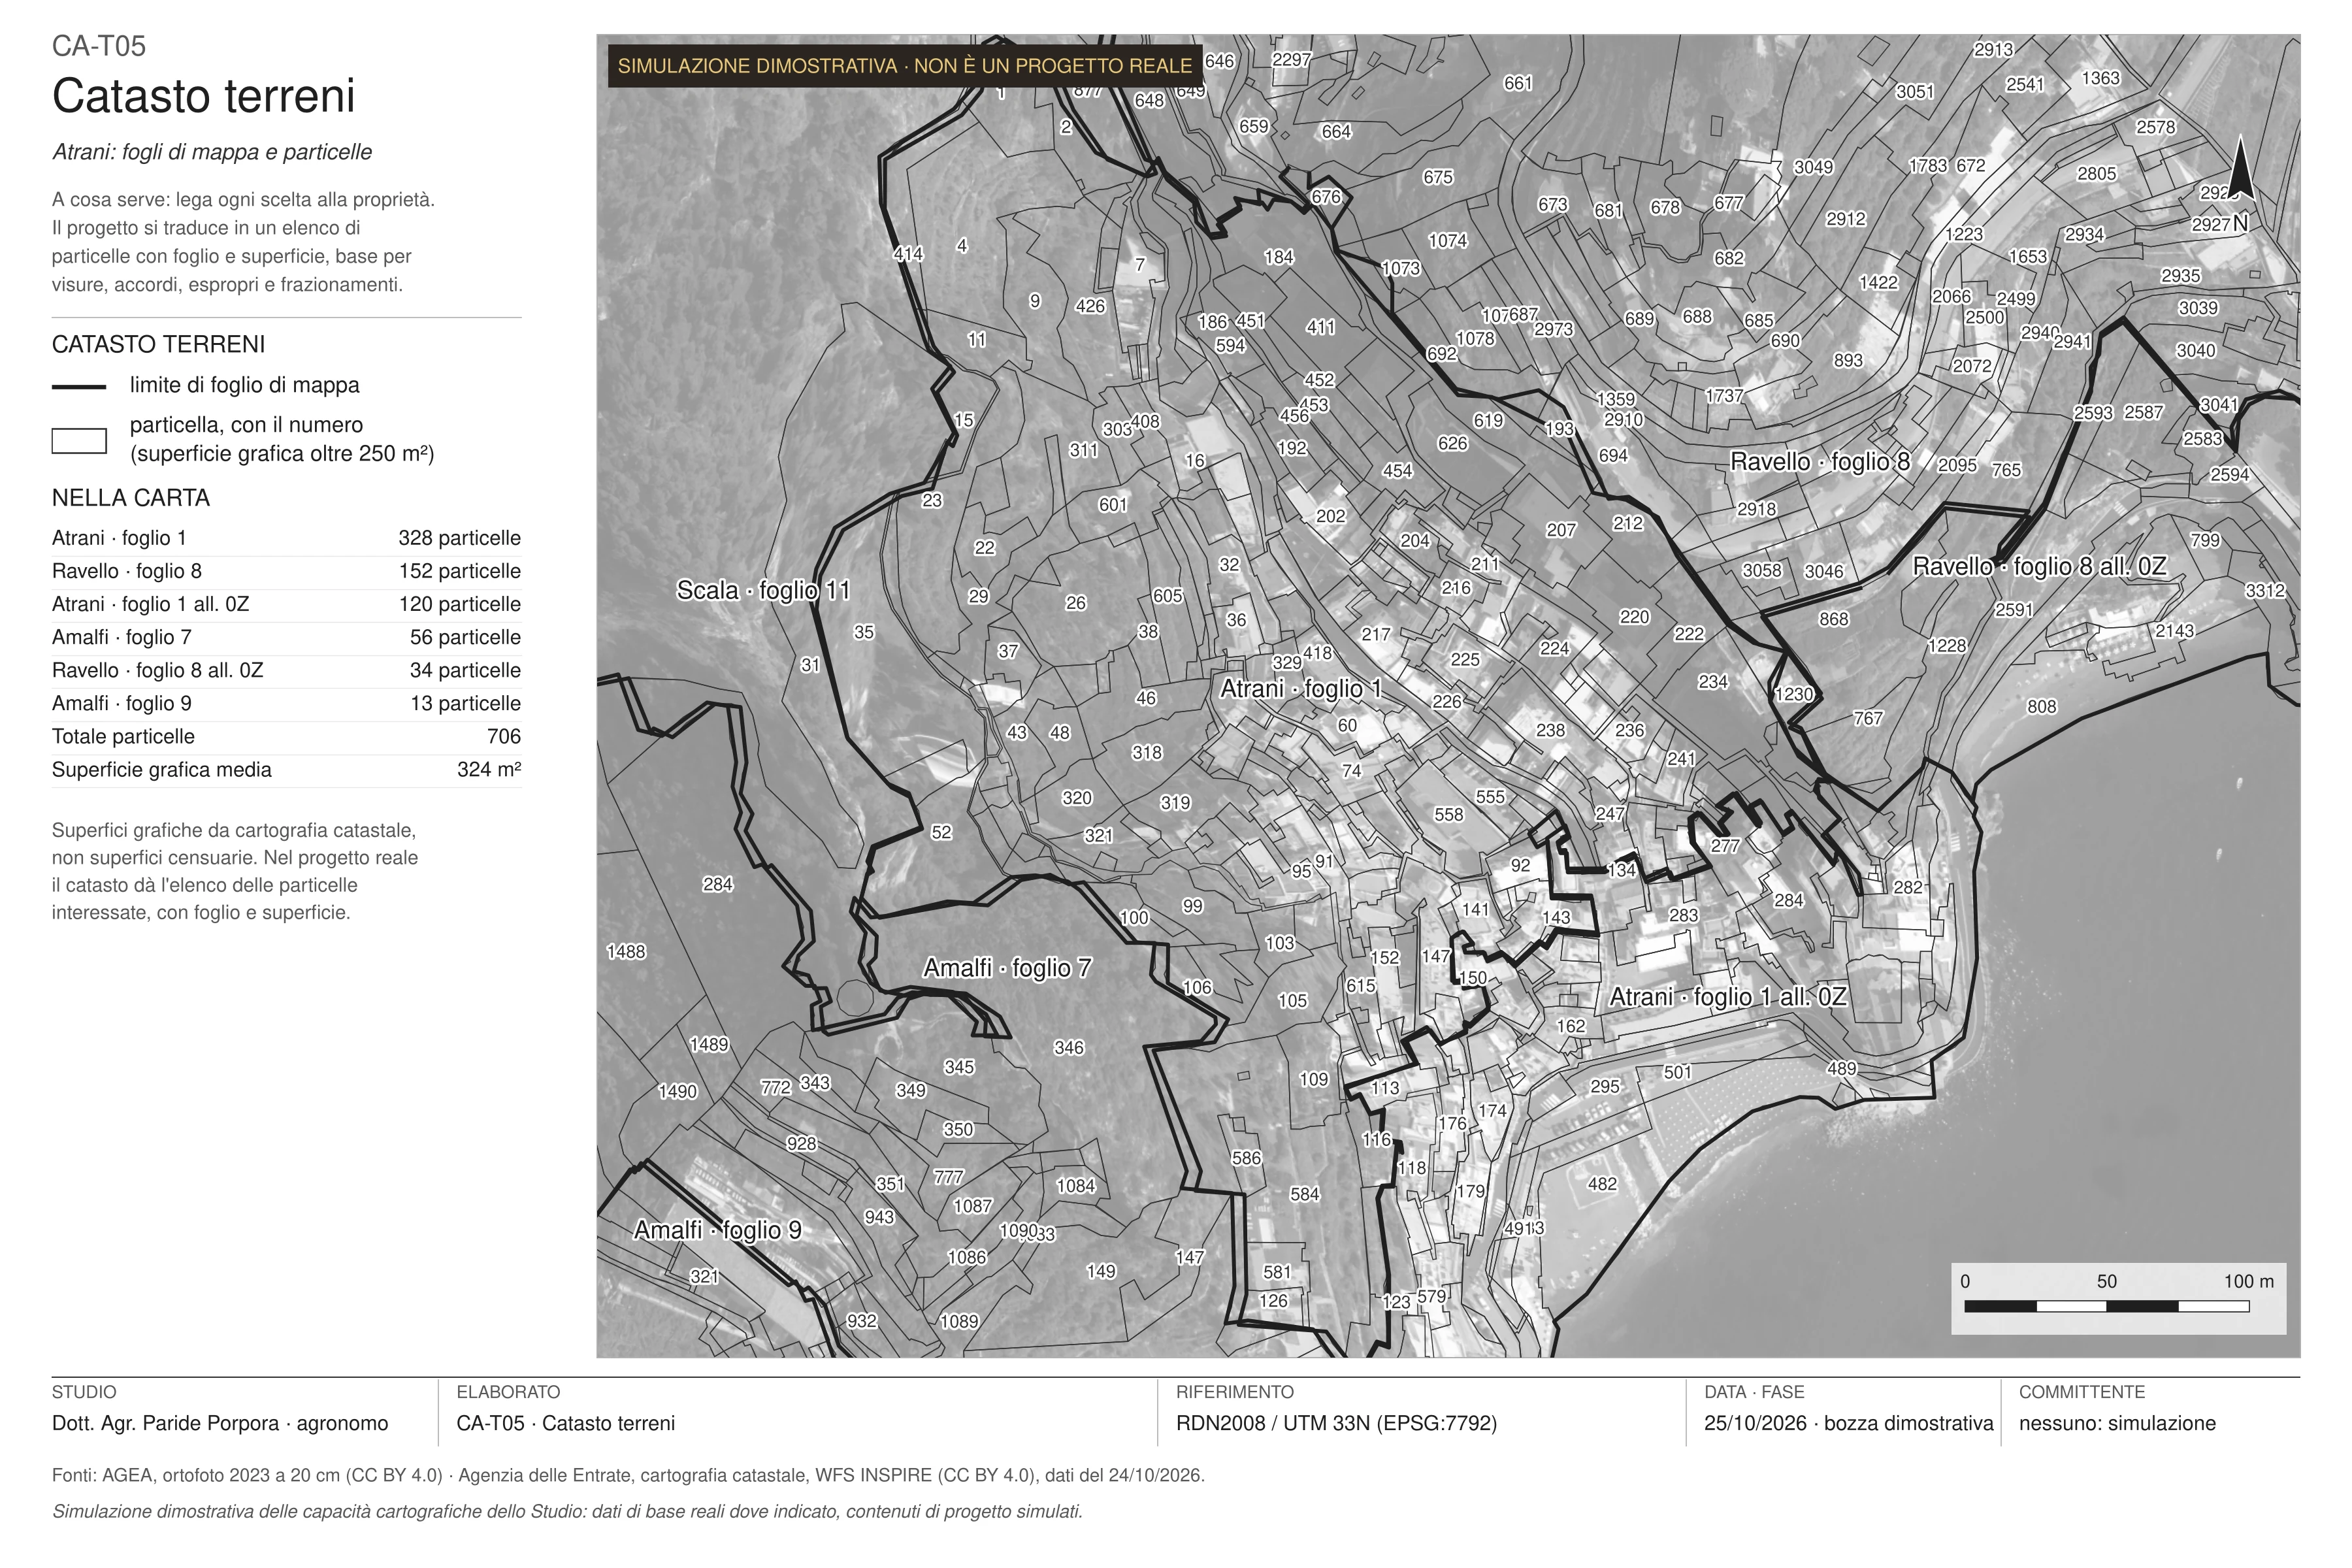
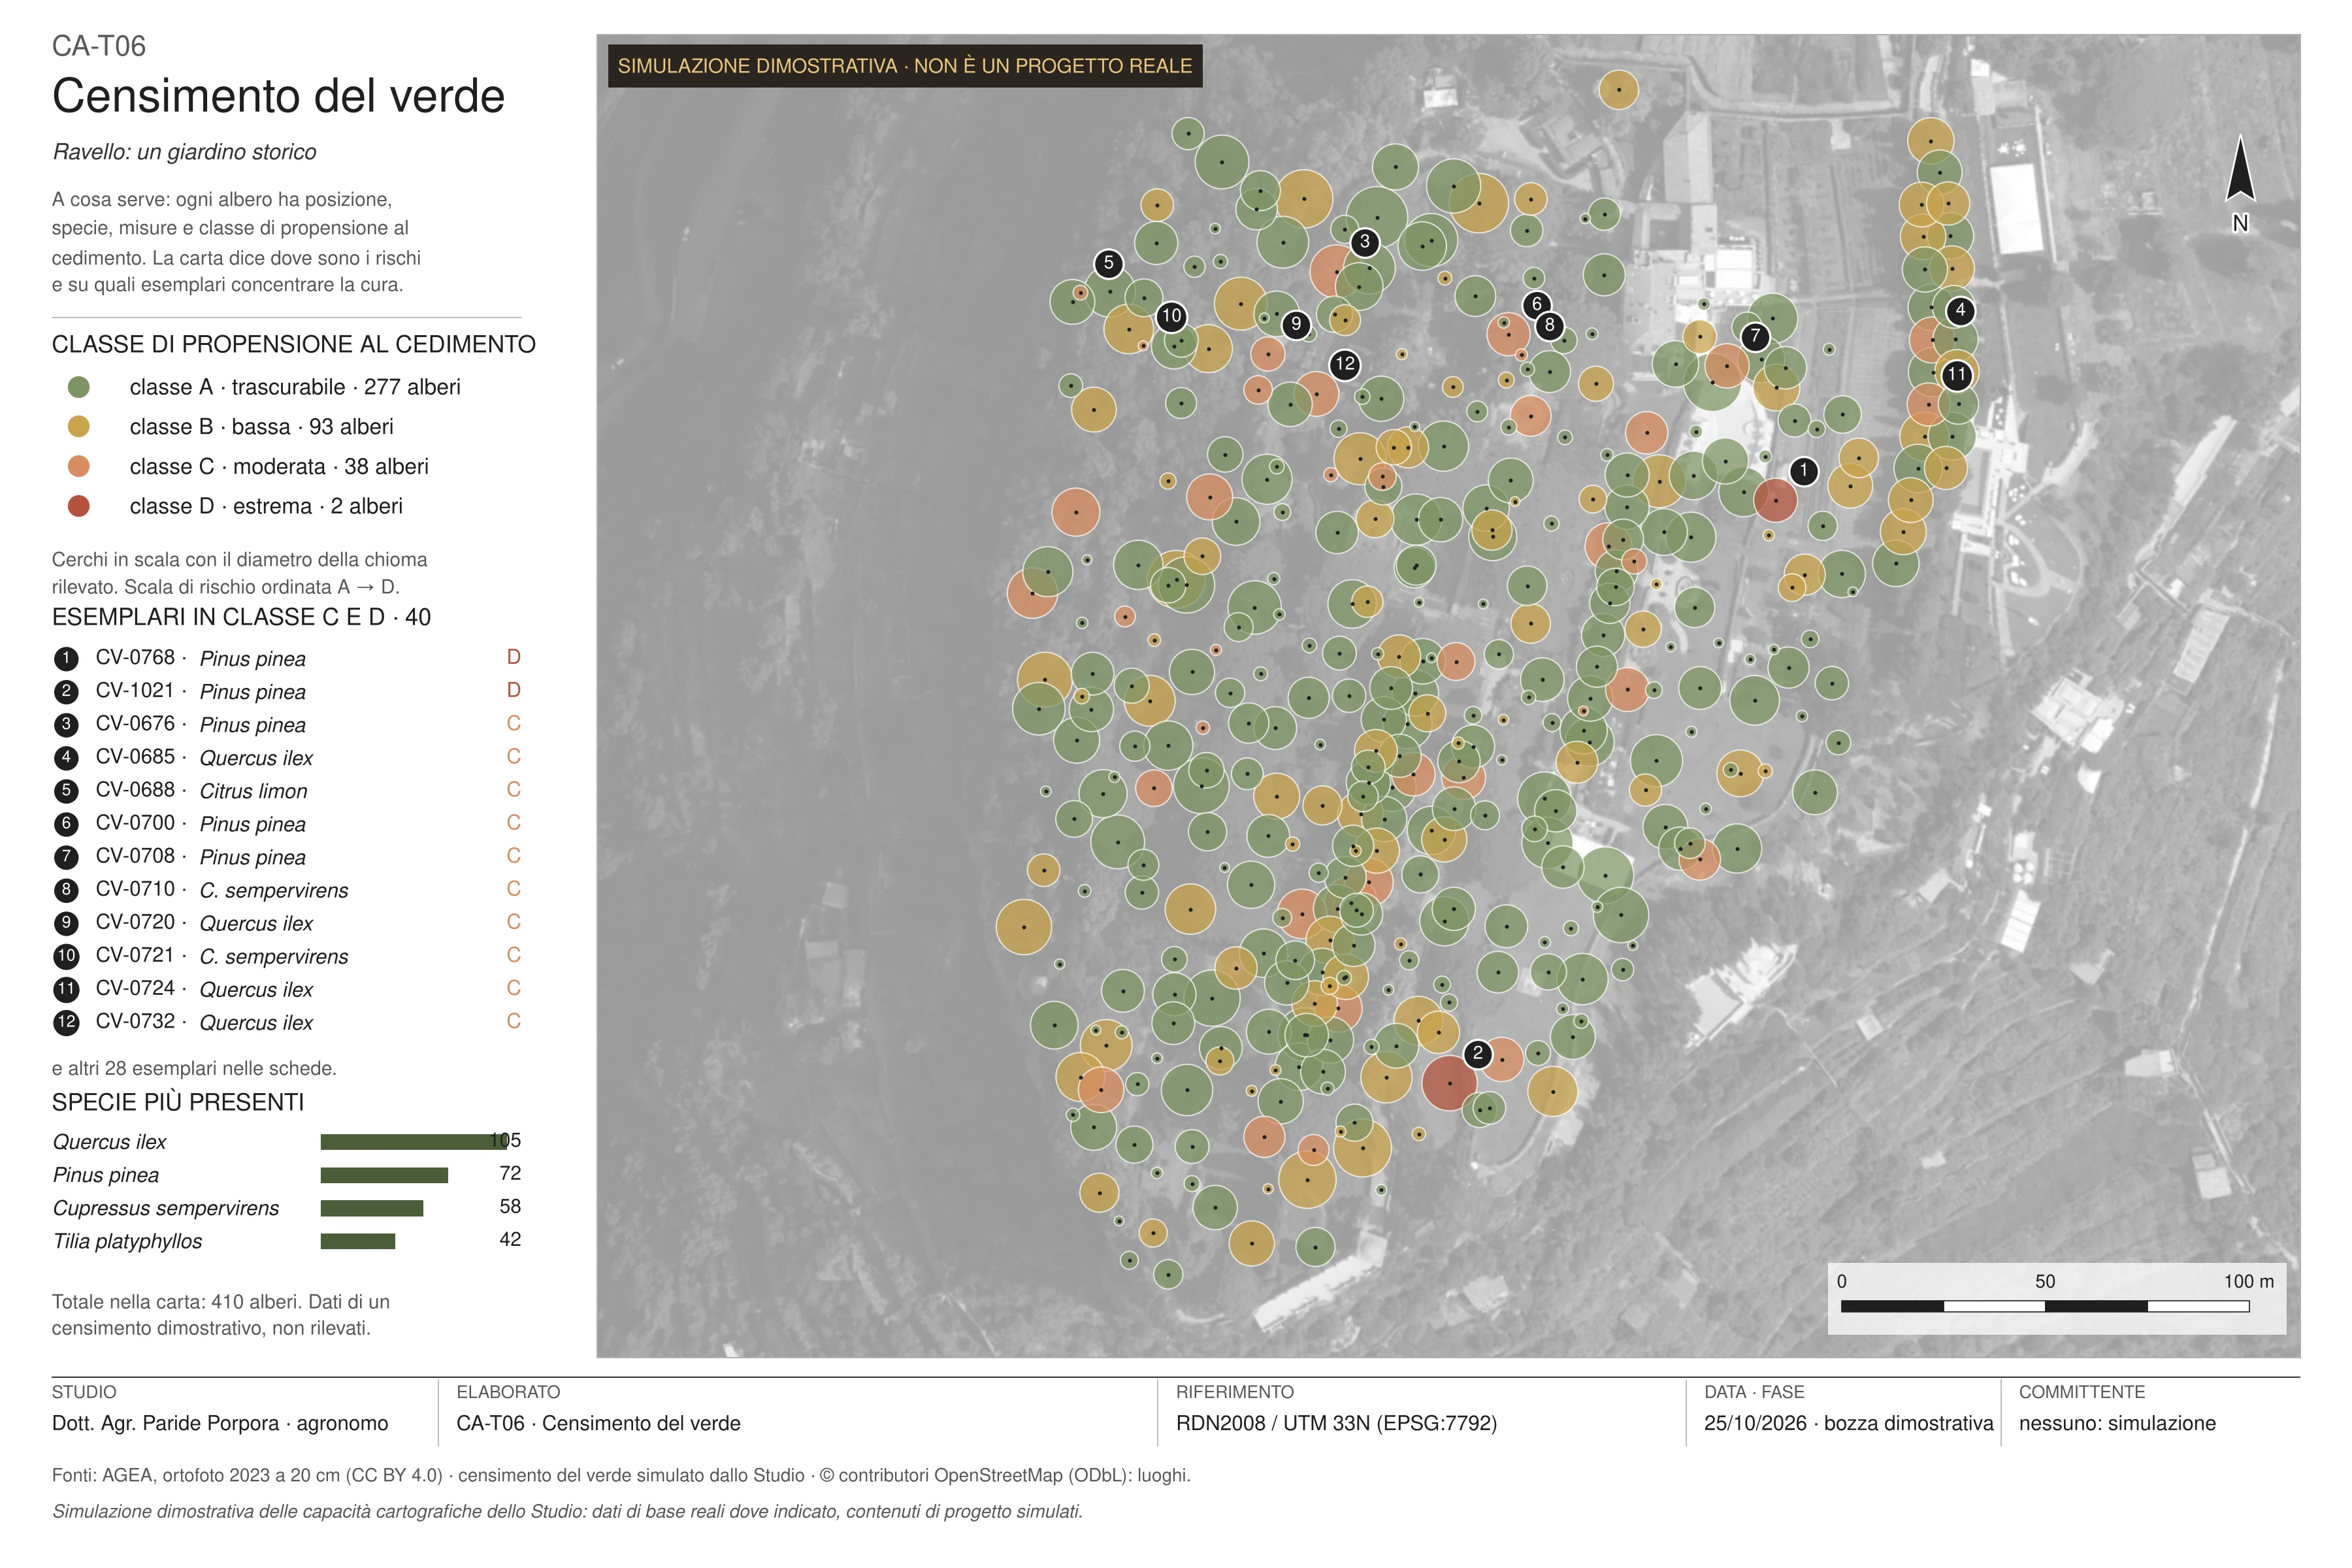
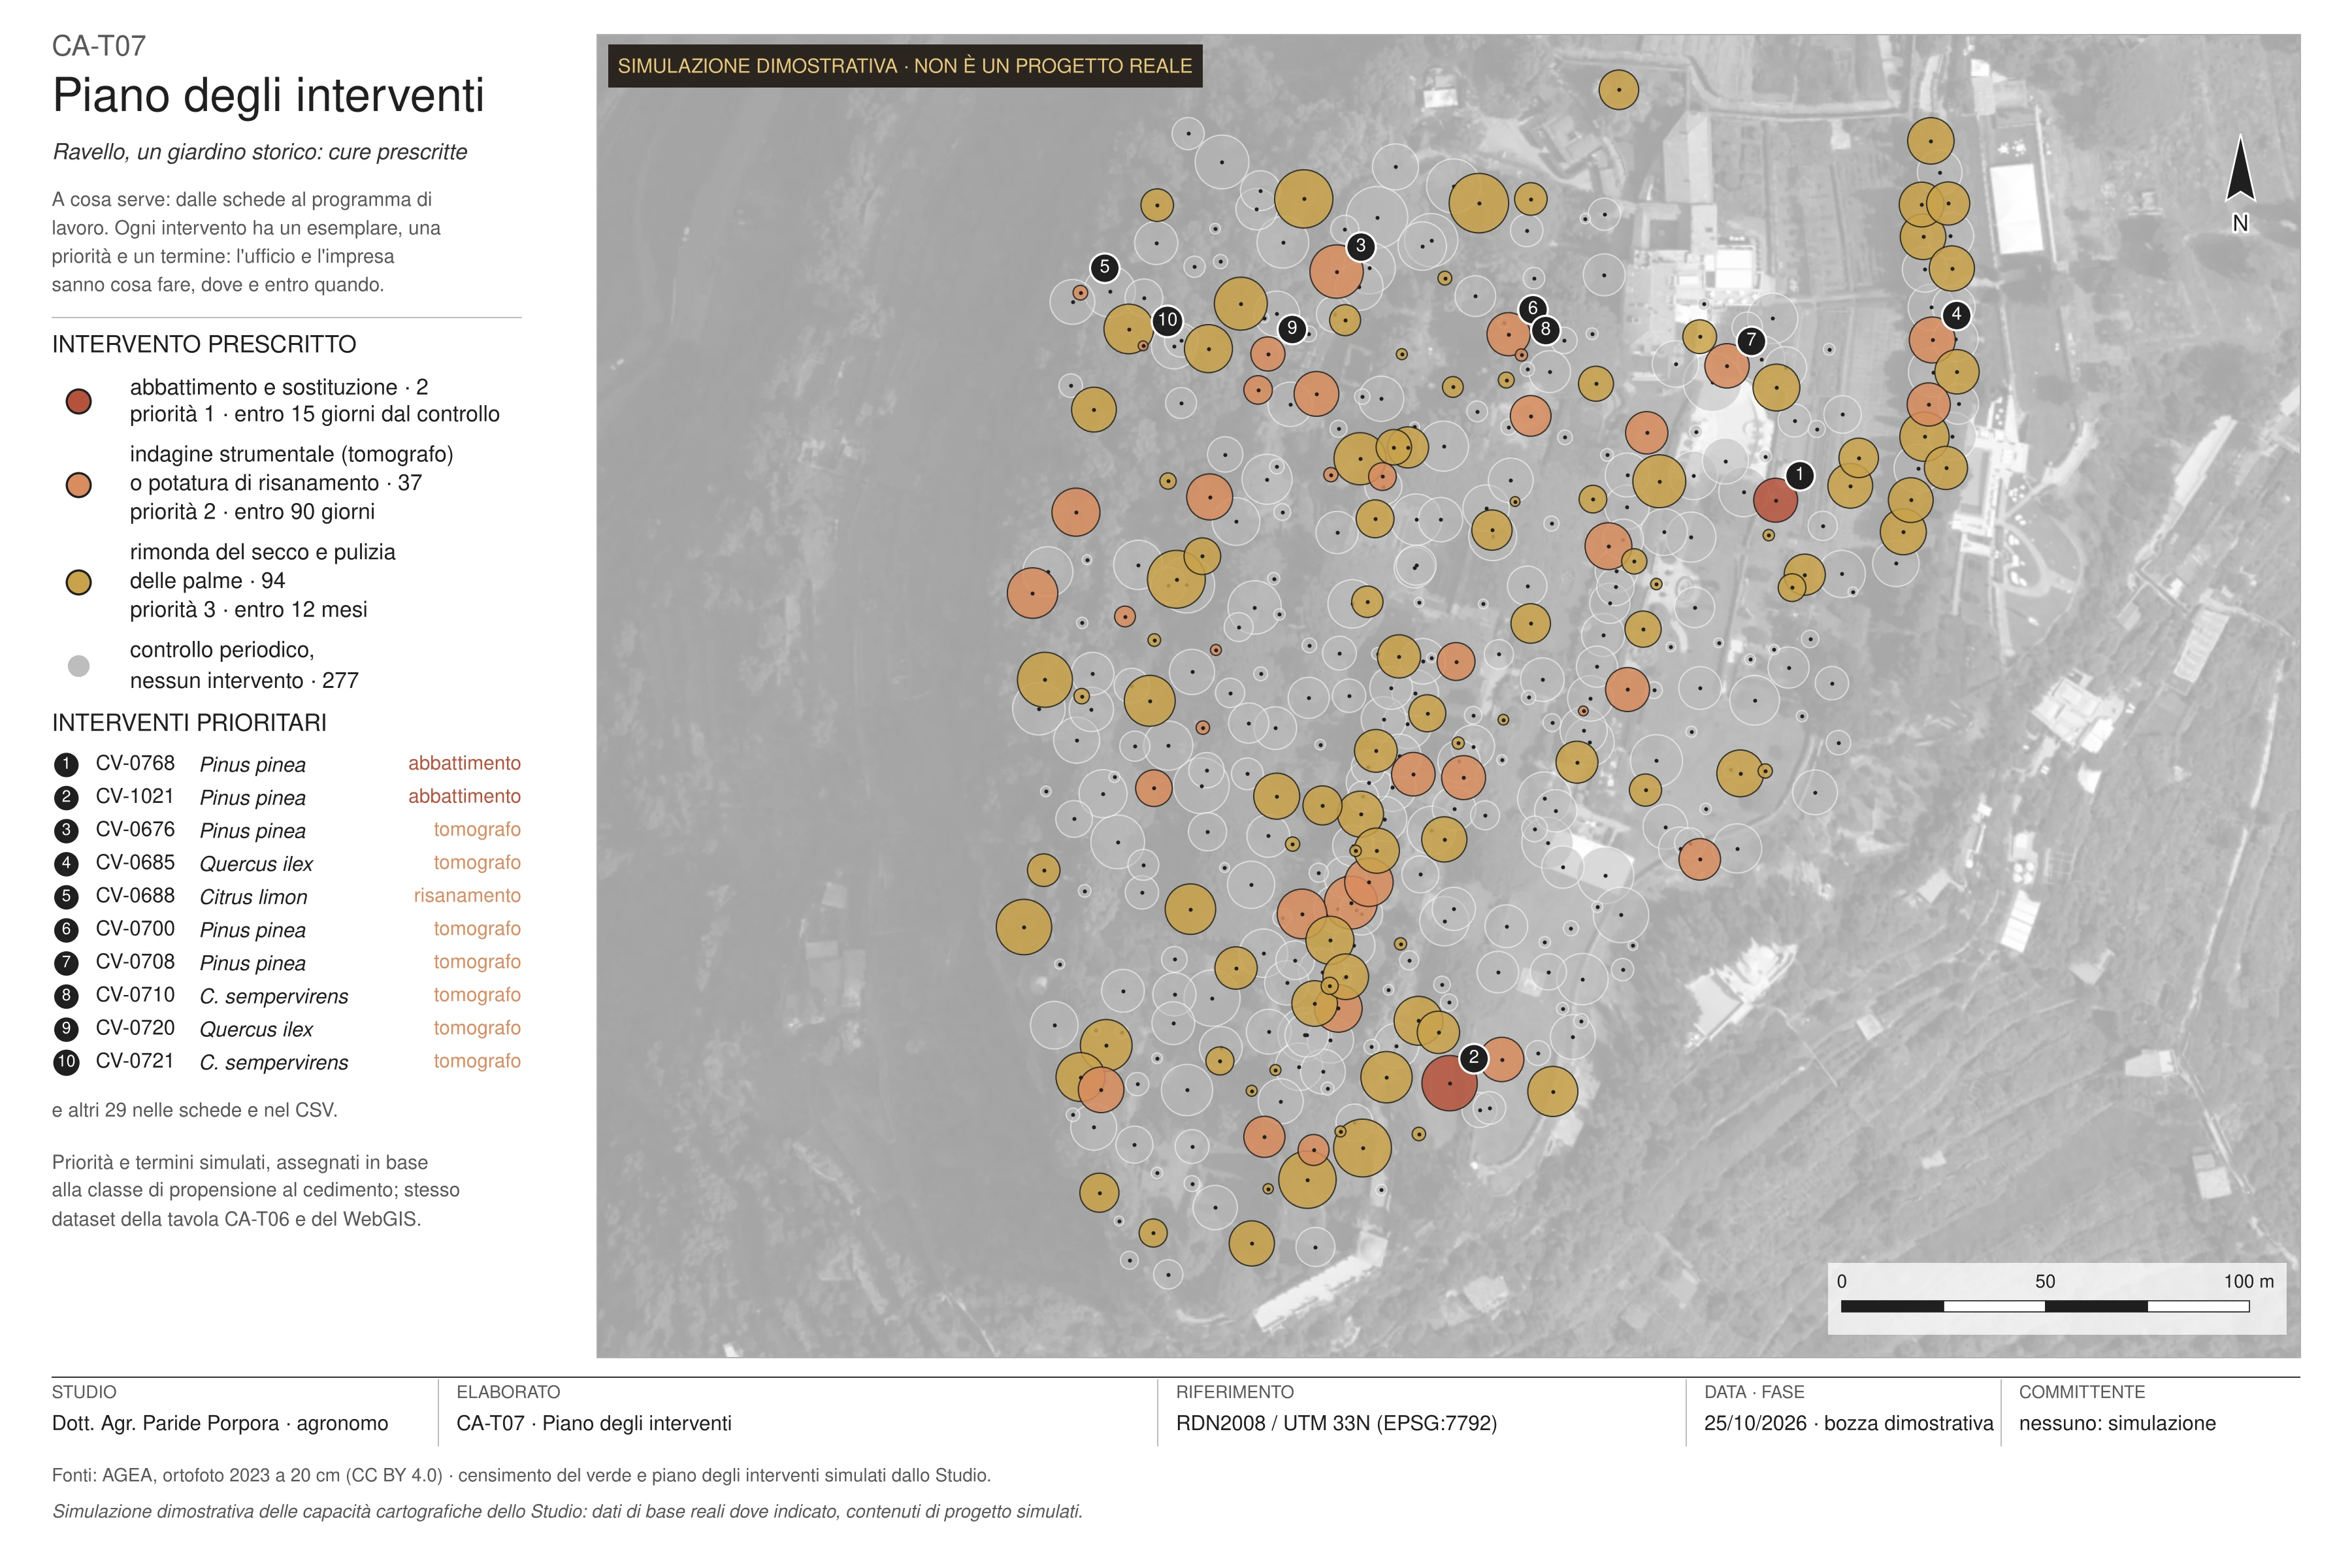
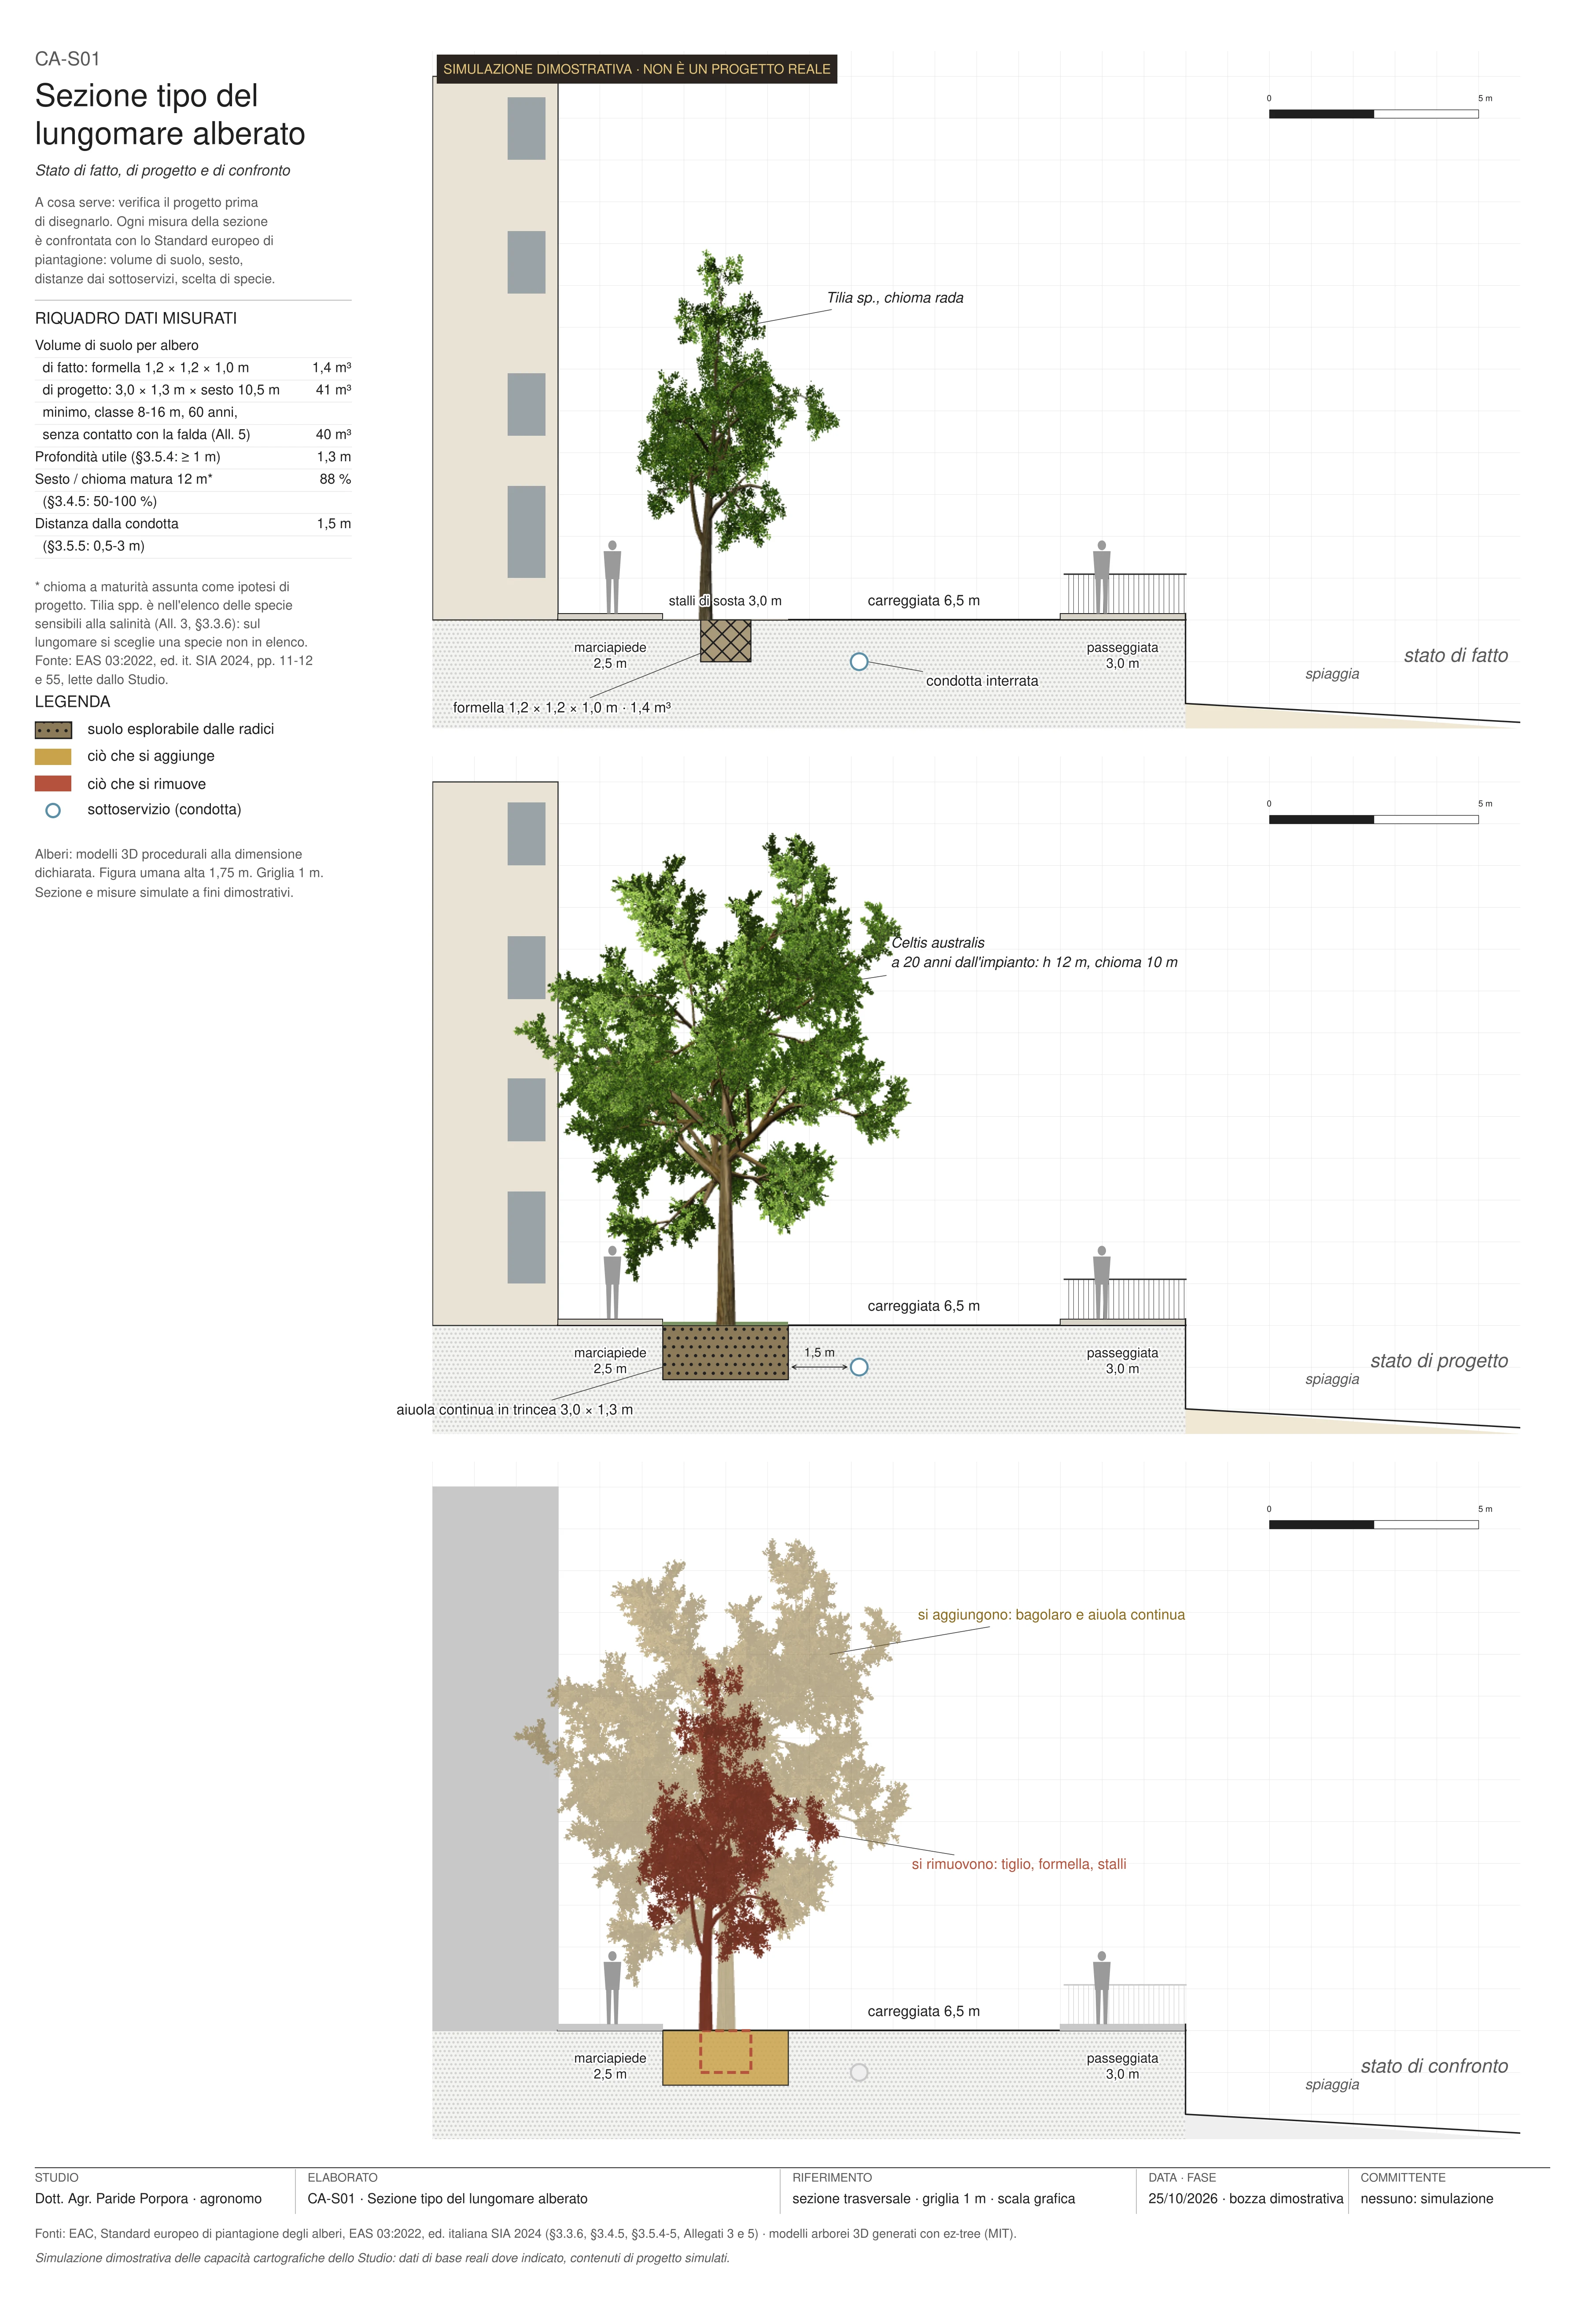
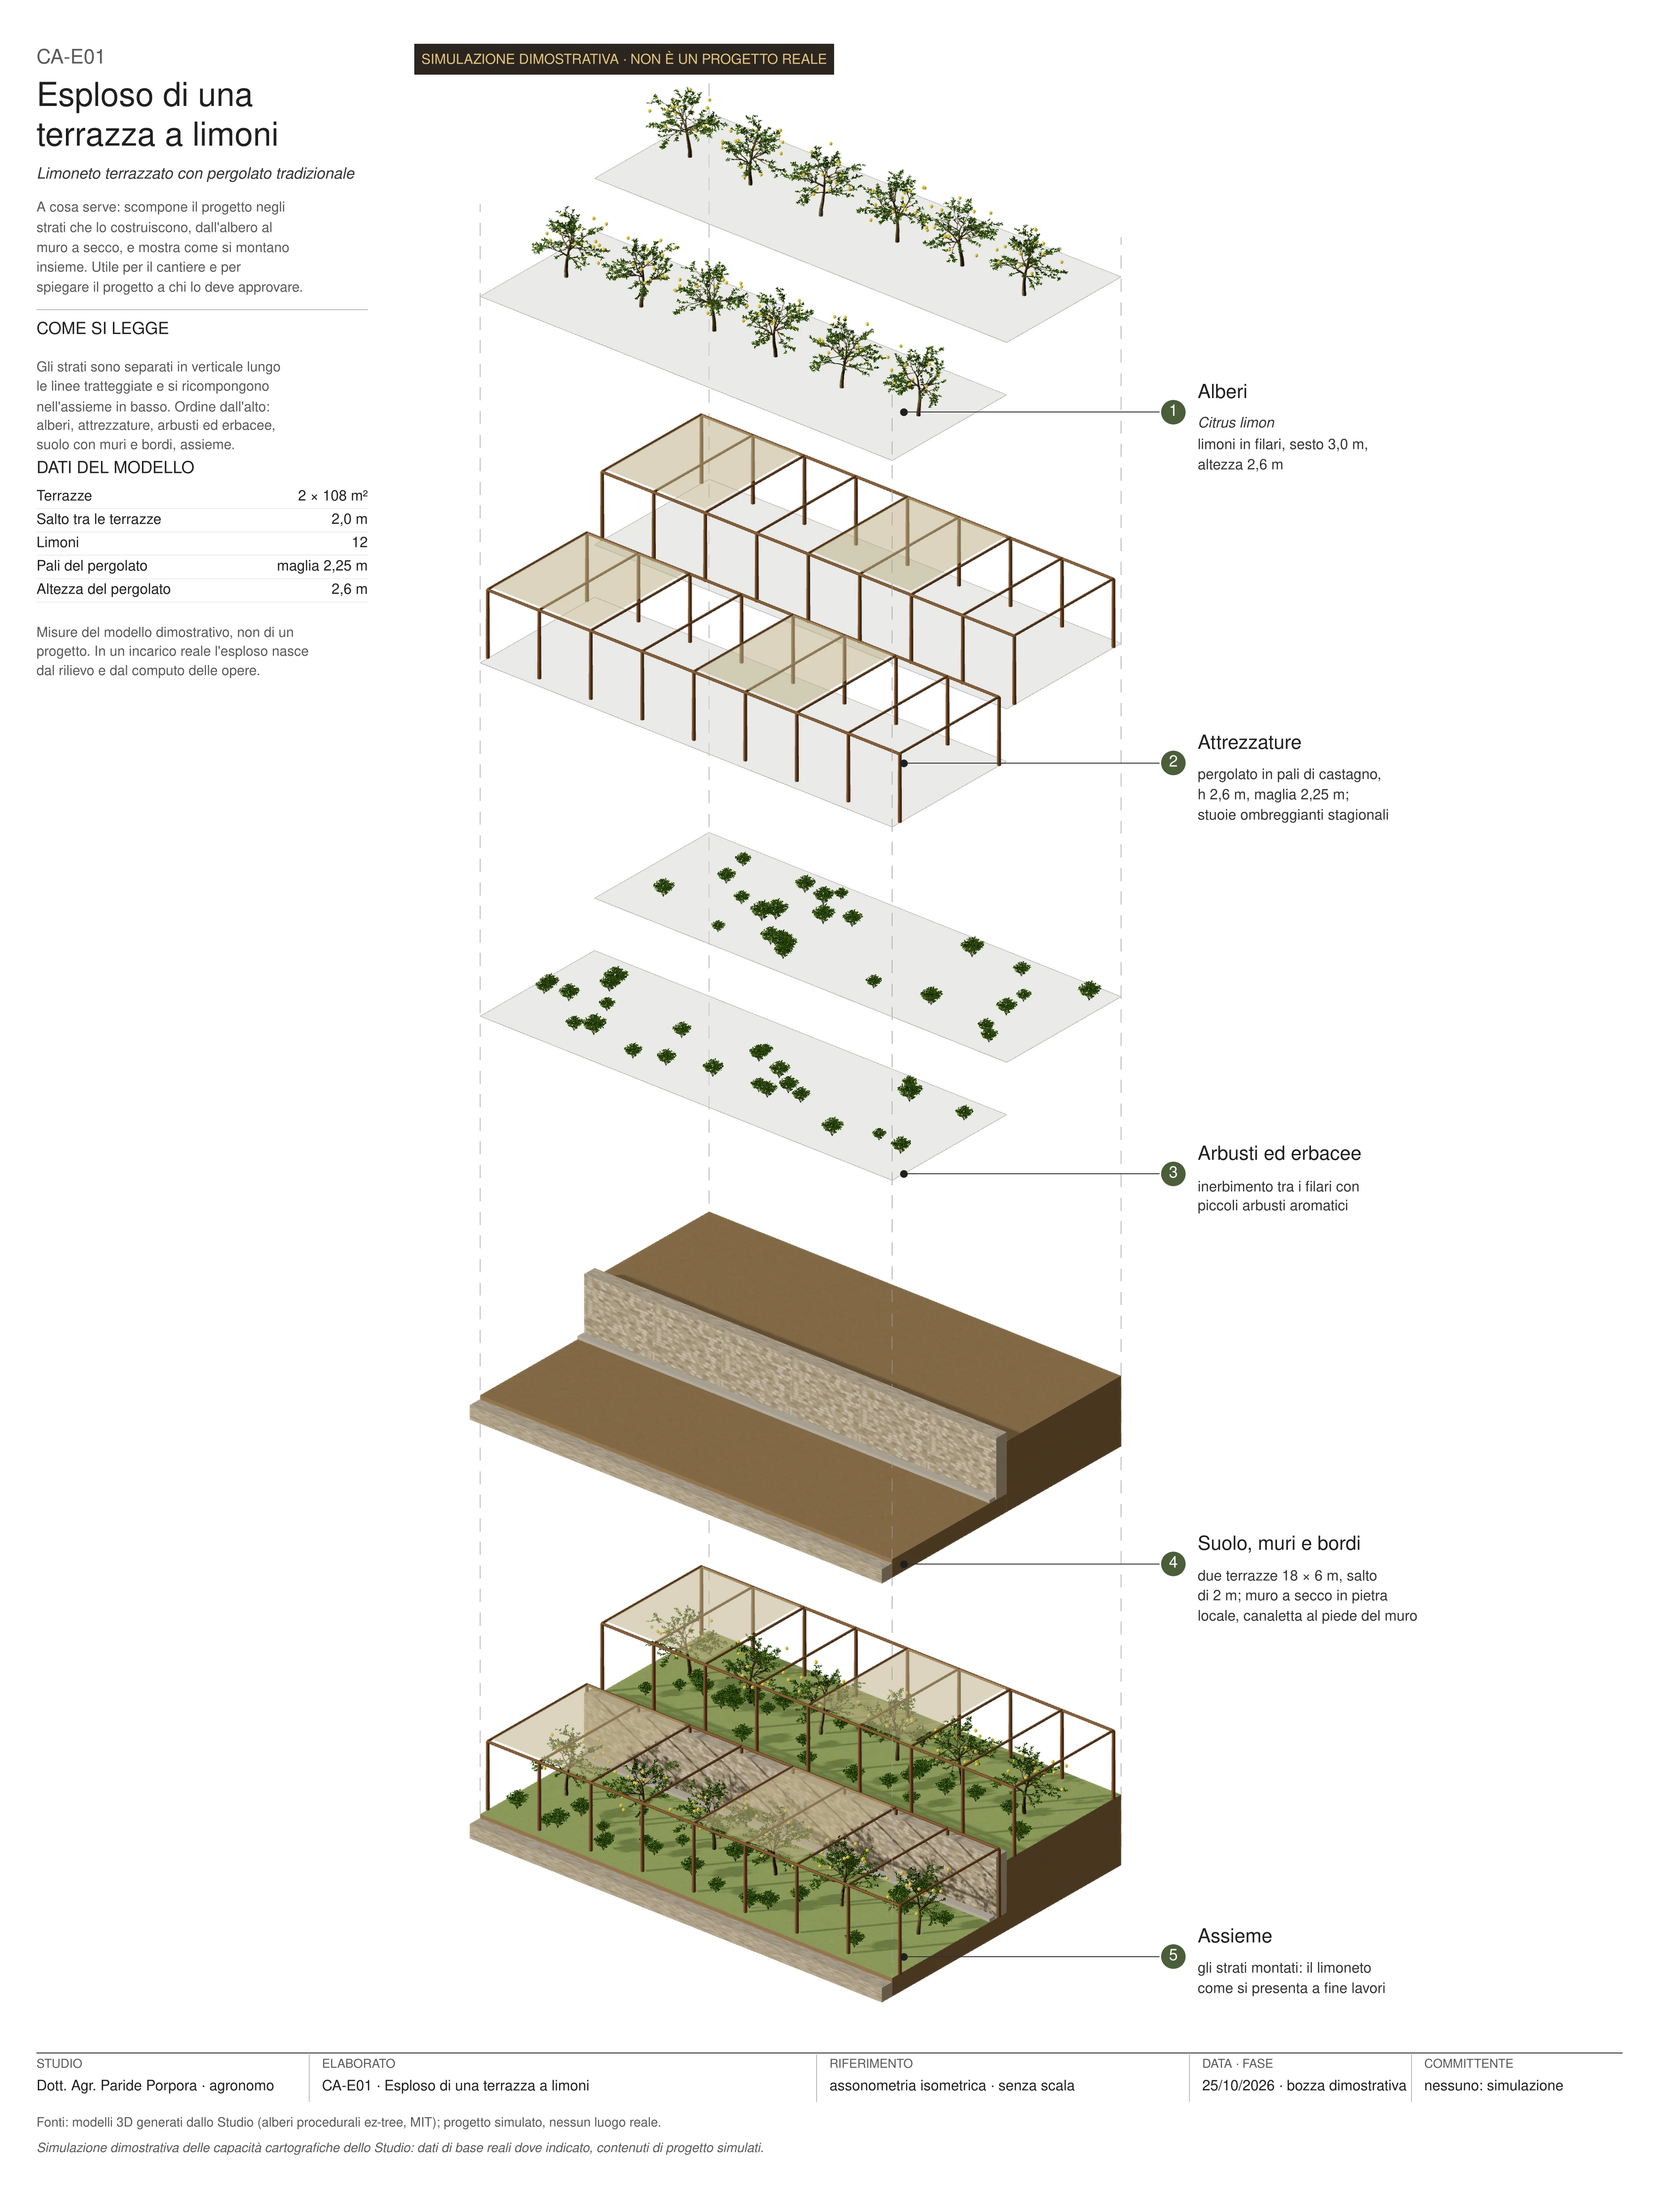
Nine sheets drawn to the Studio’s graphic standard: muted base map, one theme per sheet, legend in a column, title block with sources, declared metric reference system (RDN2008 / UTM 33N). Click a sheet for the high-resolution image.
What they are for
Planning and permits. Natura 2000 sites, protected areas and landscape constraints on the same base: the first frame of an appropriate assessment, a landscape report or a plan. The record of every point says what affects it.
Agriculture. Slope, aspect, irradiation and sunshine hours computed with the terrain horizon, vegetation vigour from the infrared band, where water flows and collects. They guide crop choice, planting, frost protection and terrace retaining works.
Urban trees and inventories. Each tree has position, species, measurements, failure-likelihood class, observed defects, prescribed intervention and deadline. The inventory becomes a map that can be queried, filtered, printed and updated: the basis of a municipal tree plan and of care scheduling.
Cadastre and appraisals. The project becomes a list of parcels with sheet and area, the basis for land-registry searches, agreements and valuations.
Design. Sections and exploded views test a design before it is drawn: in the typical section, soil volume per tree, spacing and distance from utilities are checked against the European Tree Planting Standard (EAS 03:2022).
Data and method
Every layer states its source, year and licence. In these examples: AGEA 2023 orthophoto at 20 cm with infrared band (CC BY 4.0); TINITALY 1.1 digital terrain model by INGV (CC BY 4.0); Copernicus Sentinel-2 imagery from 2025; ESA WorldCover 2021 land cover; Natura 2000 sites from the Italian Ministry of Environment and Energy Security (CC BY 4.0); historic orthophotos 1988-2012 from the National Geoportal; cadastral maps from the Italian Revenue Agency (CC BY 4.0); trails, protected areas, hydrography and buildings from OpenStreetMap (ODbL). The analyses (slopes, irradiation, vegetation indices, indicative constraint boundaries) are the Studio’s own processing, with the method stated in the applications.
What I deliver
In real work the same material is delivered as: a QGIS project with styles, data in GeoPackage and GeoTIFF, PDF map sheets at a declared scale, a WebGIS or 3D atlas published for the client, GeoJSON, KML and CSV exports for offices and contractors, and a method note with sources and limits. And first of all, always, the site visit: no technical map comes from the orthophoto alone.
Frequently asked questions
Can I have a WebGIS or a 3D atlas for my area or my farm?
Yes. It is built on the area of the assignment with the available official data and the Studio’s surveys, and delivered published online or as files to open locally, together with the data in open formats.
Do these examples describe real places and trees?
No. The land and the base data are real, but the tree inventory, interventions, crop suitability and hydrogeological constraint are simulated for the demonstration and have no connection with any public body or owner.
Can the tree inventory be updated after delivery?
Yes. The data stay in open formats and each record is updated after inspections: maps, intervention plan and deadlines are regenerated from the same data.
Which sources are the maps based on?
On declared official base maps: AGEA orthophotos, the INGV terrain model, the Ministry’s Natura 2000 network, the Revenue Agency cadastre, Copernicus imagery. Every layer states source, year and licence.
Need mapping that holds up?
Write to me describing the area, the purpose and the format you need: I will reply with a proposed method and timeline.